Immigrants from Belarus vs West Indian Vision Disability
COMPARE
Immigrants from Belarus
West Indian
Vision Disability
Vision Disability Comparison
Immigrants from Belarus
West Indians
2.0%
VISION DISABILITY
99.3/ 100
METRIC RATING
53rd/ 347
METRIC RANK
2.4%
VISION DISABILITY
0.2/ 100
METRIC RATING
257th/ 347
METRIC RANK
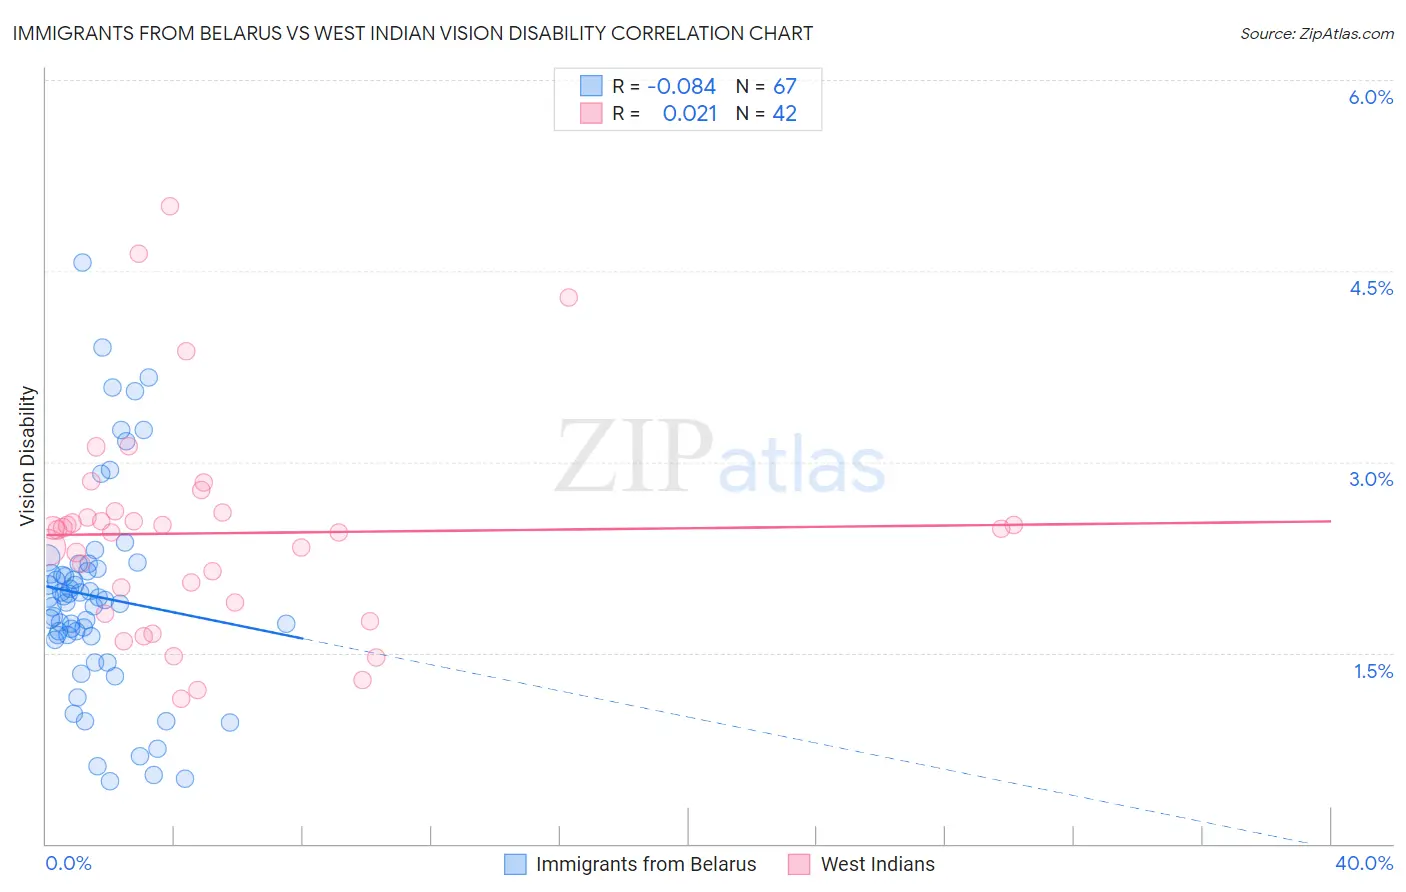
Immigrants from Belarus vs West Indian Vision Disability Correlation Chart
The statistical analysis conducted on geographies consisting of 150,159,443 people shows a slight negative correlation between the proportion of Immigrants from Belarus and percentage of population with vision disability in the United States with a correlation coefficient (R) of -0.084 and weighted average of 2.0%. Similarly, the statistical analysis conducted on geographies consisting of 253,927,950 people shows no correlation between the proportion of West Indians and percentage of population with vision disability in the United States with a correlation coefficient (R) of 0.021 and weighted average of 2.4%, a difference of 19.2%.
Vision Disability Correlation Summary
| Measurement | Immigrants from Belarus | West Indian |
| Minimum | 0.50% | 1.1% |
| Maximum | 4.6% | 5.0% |
| Range | 4.1% | 3.9% |
| Mean | 1.9% | 2.4% |
| Median | 1.9% | 2.5% |
| Interquartile 25% (IQ1) | 1.6% | 1.9% |
| Interquartile 75% (IQ3) | 2.2% | 2.6% |
| Interquartile Range (IQR) | 0.52% | 0.71% |
| Standard Deviation (Sample) | 0.82% | 0.83% |
| Standard Deviation (Population) | 0.81% | 0.82% |
Similar Demographics by Vision Disability
Demographics Similar to Immigrants from Belarus by Vision Disability
In terms of vision disability, the demographic groups most similar to Immigrants from Belarus are Macedonian (2.0%, a difference of 0.040%), Laotian (2.0%, a difference of 0.090%), Immigrants from Serbia (2.0%, a difference of 0.11%), Jordanian (2.0%, a difference of 0.26%), and Somali (2.0%, a difference of 0.28%).
| Demographics | Rating | Rank | Vision Disability |
| Immigrants | Sweden | 99.7 /100 | #46 | Exceptional 2.0% |
| Immigrants | Bulgaria | 99.7 /100 | #47 | Exceptional 2.0% |
| Israelis | 99.6 /100 | #48 | Exceptional 2.0% |
| Latvians | 99.5 /100 | #49 | Exceptional 2.0% |
| Afghans | 99.5 /100 | #50 | Exceptional 2.0% |
| Tongans | 99.5 /100 | #51 | Exceptional 2.0% |
| Immigrants | Serbia | 99.4 /100 | #52 | Exceptional 2.0% |
| Immigrants | Belarus | 99.3 /100 | #53 | Exceptional 2.0% |
| Macedonians | 99.3 /100 | #54 | Exceptional 2.0% |
| Laotians | 99.3 /100 | #55 | Exceptional 2.0% |
| Jordanians | 99.2 /100 | #56 | Exceptional 2.0% |
| Somalis | 99.2 /100 | #57 | Exceptional 2.0% |
| Immigrants | Saudi Arabia | 99.2 /100 | #58 | Exceptional 2.0% |
| Argentineans | 99.1 /100 | #59 | Exceptional 2.0% |
| Immigrants | Romania | 99.1 /100 | #60 | Exceptional 2.0% |
Demographics Similar to West Indians by Vision Disability
In terms of vision disability, the demographic groups most similar to West Indians are British West Indian (2.4%, a difference of 0.030%), White/Caucasian (2.4%, a difference of 0.040%), Immigrants from Haiti (2.4%, a difference of 0.080%), Belizean (2.4%, a difference of 0.21%), and Immigrants from Guatemala (2.4%, a difference of 0.40%).
| Demographics | Rating | Rank | Vision Disability |
| Bangladeshis | 0.5 /100 | #250 | Tragic 2.3% |
| Immigrants | Laos | 0.4 /100 | #251 | Tragic 2.4% |
| Immigrants | Micronesia | 0.3 /100 | #252 | Tragic 2.4% |
| Japanese | 0.3 /100 | #253 | Tragic 2.4% |
| Haitians | 0.3 /100 | #254 | Tragic 2.4% |
| Immigrants | Guatemala | 0.3 /100 | #255 | Tragic 2.4% |
| Immigrants | Haiti | 0.2 /100 | #256 | Tragic 2.4% |
| West Indians | 0.2 /100 | #257 | Tragic 2.4% |
| British West Indians | 0.2 /100 | #258 | Tragic 2.4% |
| Whites/Caucasians | 0.2 /100 | #259 | Tragic 2.4% |
| Belizeans | 0.2 /100 | #260 | Tragic 2.4% |
| Fijians | 0.1 /100 | #261 | Tragic 2.4% |
| Jamaicans | 0.1 /100 | #262 | Tragic 2.4% |
| Immigrants | Belize | 0.1 /100 | #263 | Tragic 2.4% |
| Immigrants | Liberia | 0.1 /100 | #264 | Tragic 2.4% |