Salvadoran vs Hispanic or Latino Vision Disability
COMPARE
Salvadoran
Hispanic or Latino
Vision Disability
Vision Disability Comparison
Salvadorans
Hispanics or Latinos
2.2%
VISION DISABILITY
27.4/ 100
METRIC RATING
189th/ 347
METRIC RANK
2.6%
VISION DISABILITY
0.0/ 100
METRIC RATING
305th/ 347
METRIC RANK
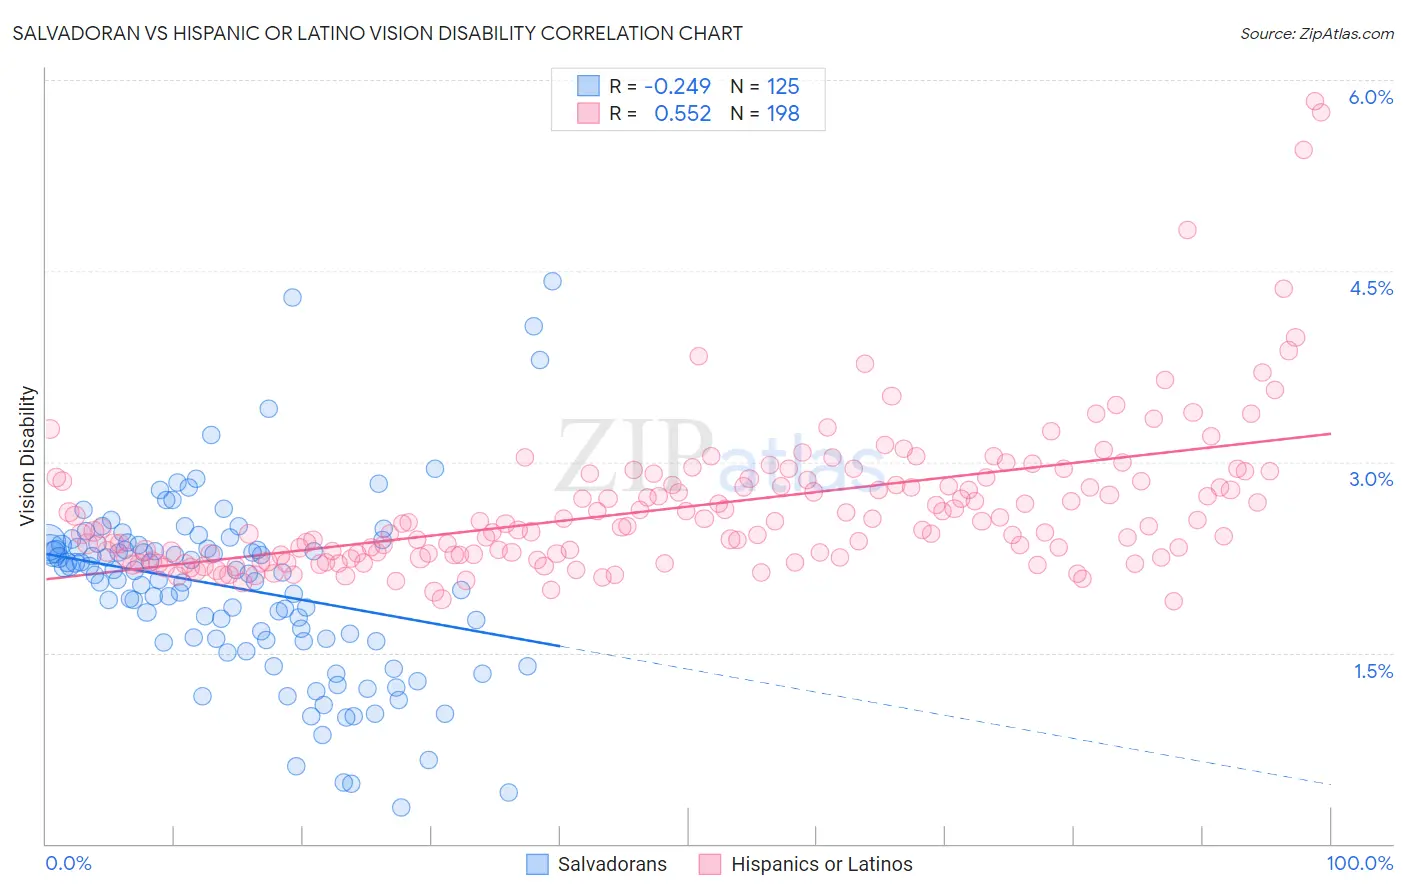
Salvadoran vs Hispanic or Latino Vision Disability Correlation Chart
The statistical analysis conducted on geographies consisting of 398,695,149 people shows a weak negative correlation between the proportion of Salvadorans and percentage of population with vision disability in the United States with a correlation coefficient (R) of -0.249 and weighted average of 2.2%. Similarly, the statistical analysis conducted on geographies consisting of 574,500,029 people shows a substantial positive correlation between the proportion of Hispanics or Latinos and percentage of population with vision disability in the United States with a correlation coefficient (R) of 0.552 and weighted average of 2.6%, a difference of 17.9%.
Vision Disability Correlation Summary
| Measurement | Salvadoran | Hispanic or Latino |
| Minimum | 0.28% | 1.9% |
| Maximum | 4.4% | 5.8% |
| Range | 4.1% | 3.9% |
| Mean | 2.0% | 2.6% |
| Median | 2.1% | 2.5% |
| Interquartile 25% (IQ1) | 1.6% | 2.3% |
| Interquartile 75% (IQ3) | 2.3% | 2.9% |
| Interquartile Range (IQR) | 0.75% | 0.59% |
| Standard Deviation (Sample) | 0.72% | 0.59% |
| Standard Deviation (Population) | 0.71% | 0.59% |
Similar Demographics by Vision Disability
Demographics Similar to Salvadorans by Vision Disability
In terms of vision disability, the demographic groups most similar to Salvadorans are Guyanese (2.2%, a difference of 0.11%), Immigrants from Costa Rica (2.2%, a difference of 0.11%), Canadian (2.2%, a difference of 0.13%), European (2.2%, a difference of 0.13%), and British (2.2%, a difference of 0.19%).
| Demographics | Rating | Rank | Vision Disability |
| Costa Ricans | 40.7 /100 | #182 | Average 2.2% |
| Immigrants | Burma/Myanmar | 37.9 /100 | #183 | Fair 2.2% |
| Moroccans | 35.4 /100 | #184 | Fair 2.2% |
| Immigrants | Middle Africa | 33.5 /100 | #185 | Fair 2.2% |
| Native Hawaiians | 33.3 /100 | #186 | Fair 2.2% |
| Immigrants | St. Vincent and the Grenadines | 30.3 /100 | #187 | Fair 2.2% |
| Guyanese | 28.9 /100 | #188 | Fair 2.2% |
| Salvadorans | 27.4 /100 | #189 | Fair 2.2% |
| Immigrants | Costa Rica | 26.1 /100 | #190 | Fair 2.2% |
| Canadians | 25.8 /100 | #191 | Fair 2.2% |
| Europeans | 25.7 /100 | #192 | Fair 2.2% |
| British | 25.1 /100 | #193 | Fair 2.2% |
| Immigrants | Barbados | 24.0 /100 | #194 | Fair 2.2% |
| Immigrants | Immigrants | 23.7 /100 | #195 | Fair 2.2% |
| Immigrants | Grenada | 23.1 /100 | #196 | Fair 2.2% |
Demographics Similar to Hispanics or Latinos by Vision Disability
In terms of vision disability, the demographic groups most similar to Hispanics or Latinos are Aleut (2.6%, a difference of 0.30%), Immigrants from Cabo Verde (2.6%, a difference of 0.43%), Iroquois (2.6%, a difference of 0.61%), Immigrants from Dominican Republic (2.6%, a difference of 0.64%), and Arapaho (2.6%, a difference of 0.65%).
| Demographics | Rating | Rank | Vision Disability |
| Mexicans | 0.0 /100 | #298 | Tragic 2.5% |
| Cree | 0.0 /100 | #299 | Tragic 2.5% |
| Africans | 0.0 /100 | #300 | Tragic 2.5% |
| Menominee | 0.0 /100 | #301 | Tragic 2.5% |
| Spanish American Indians | 0.0 /100 | #302 | Tragic 2.6% |
| Immigrants | Cabo Verde | 0.0 /100 | #303 | Tragic 2.6% |
| Aleuts | 0.0 /100 | #304 | Tragic 2.6% |
| Hispanics or Latinos | 0.0 /100 | #305 | Tragic 2.6% |
| Iroquois | 0.0 /100 | #306 | Tragic 2.6% |
| Immigrants | Dominican Republic | 0.0 /100 | #307 | Tragic 2.6% |
| Arapaho | 0.0 /100 | #308 | Tragic 2.6% |
| Immigrants | Yemen | 0.0 /100 | #309 | Tragic 2.6% |
| Blackfeet | 0.0 /100 | #310 | Tragic 2.6% |
| Dominicans | 0.0 /100 | #311 | Tragic 2.6% |
| Americans | 0.0 /100 | #312 | Tragic 2.6% |