Salvadoran vs Cree Hearing Disability
COMPARE
Salvadoran
Cree
Hearing Disability
Hearing Disability Comparison
Salvadorans
Cree
2.6%
HEARING DISABILITY
99.6/ 100
METRIC RATING
35th/ 347
METRIC RANK
3.8%
HEARING DISABILITY
0.0/ 100
METRIC RATING
310th/ 347
METRIC RANK
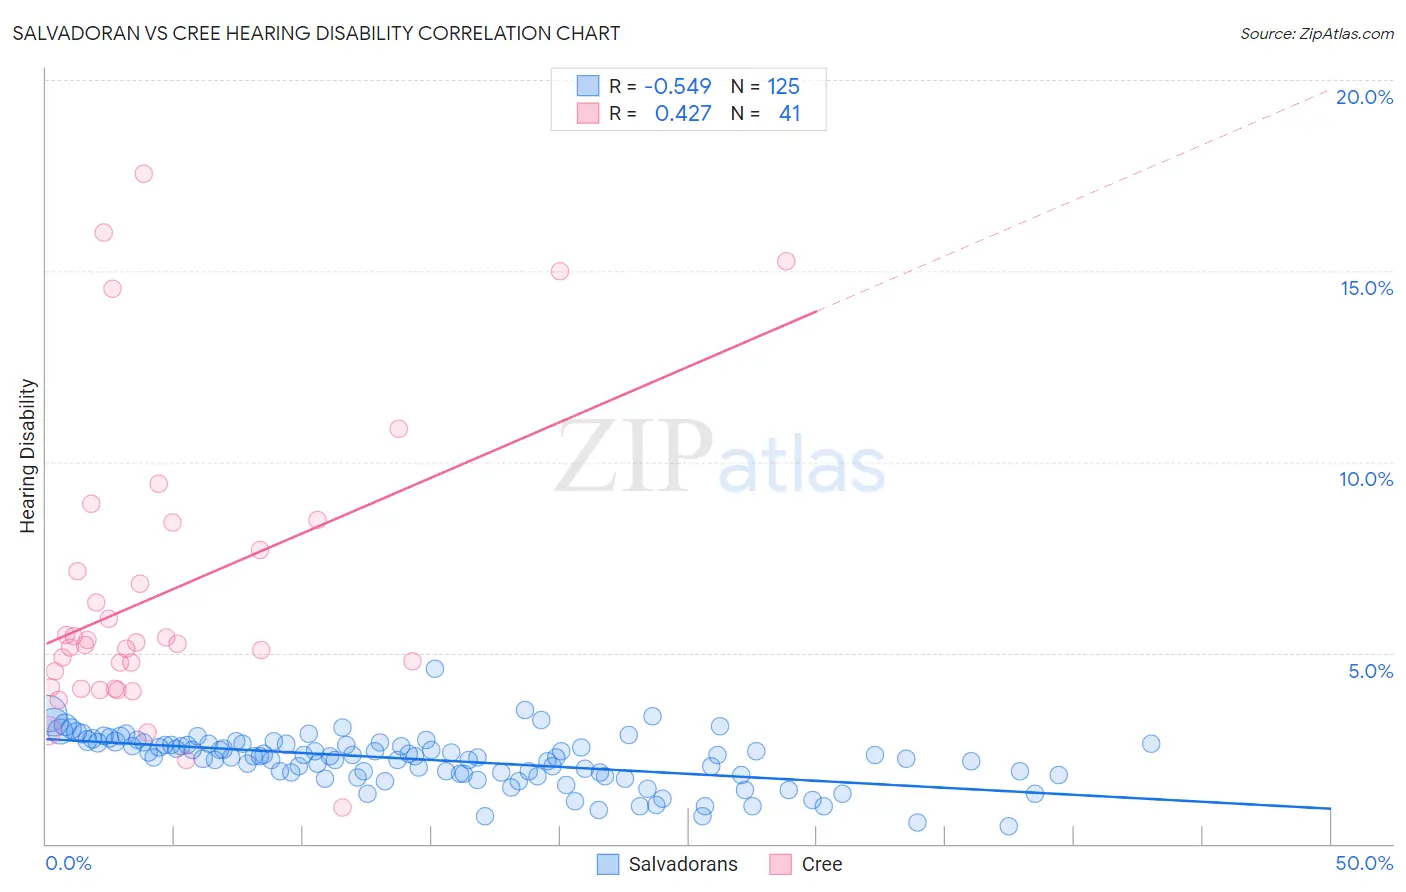
Salvadoran vs Cree Hearing Disability Correlation Chart
The statistical analysis conducted on geographies consisting of 398,804,647 people shows a substantial negative correlation between the proportion of Salvadorans and percentage of population with hearing disability in the United States with a correlation coefficient (R) of -0.549 and weighted average of 2.6%. Similarly, the statistical analysis conducted on geographies consisting of 76,207,567 people shows a moderate positive correlation between the proportion of Cree and percentage of population with hearing disability in the United States with a correlation coefficient (R) of 0.427 and weighted average of 3.8%, a difference of 47.3%.
Hearing Disability Correlation Summary
| Measurement | Salvadoran | Cree |
| Minimum | 0.44% | 0.96% |
| Maximum | 4.6% | 17.6% |
| Range | 4.1% | 16.6% |
| Mean | 2.2% | 6.6% |
| Median | 2.3% | 5.2% |
| Interquartile 25% (IQ1) | 1.8% | 4.1% |
| Interquartile 75% (IQ3) | 2.6% | 8.0% |
| Interquartile Range (IQR) | 0.81% | 4.0% |
| Standard Deviation (Sample) | 0.67% | 3.9% |
| Standard Deviation (Population) | 0.67% | 3.9% |
Similar Demographics by Hearing Disability
Demographics Similar to Salvadorans by Hearing Disability
In terms of hearing disability, the demographic groups most similar to Salvadorans are Immigrants from Pakistan (2.6%, a difference of 0.12%), Filipino (2.6%, a difference of 0.16%), Okinawan (2.6%, a difference of 0.22%), Immigrants from Western Africa (2.6%, a difference of 0.25%), and Immigrants from Jamaica (2.6%, a difference of 0.33%).
| Demographics | Rating | Rank | Hearing Disability |
| Immigrants | Haiti | 99.7 /100 | #28 | Exceptional 2.6% |
| Bolivians | 99.7 /100 | #29 | Exceptional 2.6% |
| Immigrants | Caribbean | 99.7 /100 | #30 | Exceptional 2.6% |
| Immigrants | Cameroon | 99.7 /100 | #31 | Exceptional 2.6% |
| Immigrants | Venezuela | 99.7 /100 | #32 | Exceptional 2.6% |
| Filipinos | 99.6 /100 | #33 | Exceptional 2.6% |
| Immigrants | Pakistan | 99.6 /100 | #34 | Exceptional 2.6% |
| Salvadorans | 99.6 /100 | #35 | Exceptional 2.6% |
| Okinawans | 99.6 /100 | #36 | Exceptional 2.6% |
| Immigrants | Western Africa | 99.6 /100 | #37 | Exceptional 2.6% |
| Immigrants | Jamaica | 99.5 /100 | #38 | Exceptional 2.6% |
| Immigrants | China | 99.5 /100 | #39 | Exceptional 2.6% |
| Haitians | 99.5 /100 | #40 | Exceptional 2.6% |
| Immigrants | Taiwan | 99.4 /100 | #41 | Exceptional 2.6% |
| West Indians | 99.4 /100 | #42 | Exceptional 2.6% |
Demographics Similar to Cree by Hearing Disability
In terms of hearing disability, the demographic groups most similar to Cree are Scotch-Irish (3.8%, a difference of 0.31%), Ottawa (3.8%, a difference of 0.39%), French Canadian (3.8%, a difference of 0.83%), Marshallese (3.8%, a difference of 0.95%), and American (3.9%, a difference of 1.3%).
| Demographics | Rating | Rank | Hearing Disability |
| Menominee | 0.0 /100 | #303 | Tragic 3.7% |
| French | 0.0 /100 | #304 | Tragic 3.8% |
| English | 0.0 /100 | #305 | Tragic 3.8% |
| Marshallese | 0.0 /100 | #306 | Tragic 3.8% |
| French Canadians | 0.0 /100 | #307 | Tragic 3.8% |
| Ottawa | 0.0 /100 | #308 | Tragic 3.8% |
| Scotch-Irish | 0.0 /100 | #309 | Tragic 3.8% |
| Cree | 0.0 /100 | #310 | Tragic 3.8% |
| Americans | 0.0 /100 | #311 | Tragic 3.9% |
| Cajuns | 0.0 /100 | #312 | Tragic 3.9% |
| Hopi | 0.0 /100 | #313 | Tragic 3.9% |
| Yakama | 0.0 /100 | #314 | Tragic 3.9% |
| Puget Sound Salish | 0.0 /100 | #315 | Tragic 3.9% |
| Spanish Americans | 0.0 /100 | #316 | Tragic 4.0% |
| Comanche | 0.0 /100 | #317 | Tragic 4.0% |