Salvadoran vs Immigrants from Guatemala Hearing Disability
COMPARE
Salvadoran
Immigrants from Guatemala
Hearing Disability
Hearing Disability Comparison
Salvadorans
Immigrants from Guatemala
2.6%
HEARING DISABILITY
99.6/ 100
METRIC RATING
35th/ 347
METRIC RANK
2.8%
HEARING DISABILITY
95.1/ 100
METRIC RATING
99th/ 347
METRIC RANK
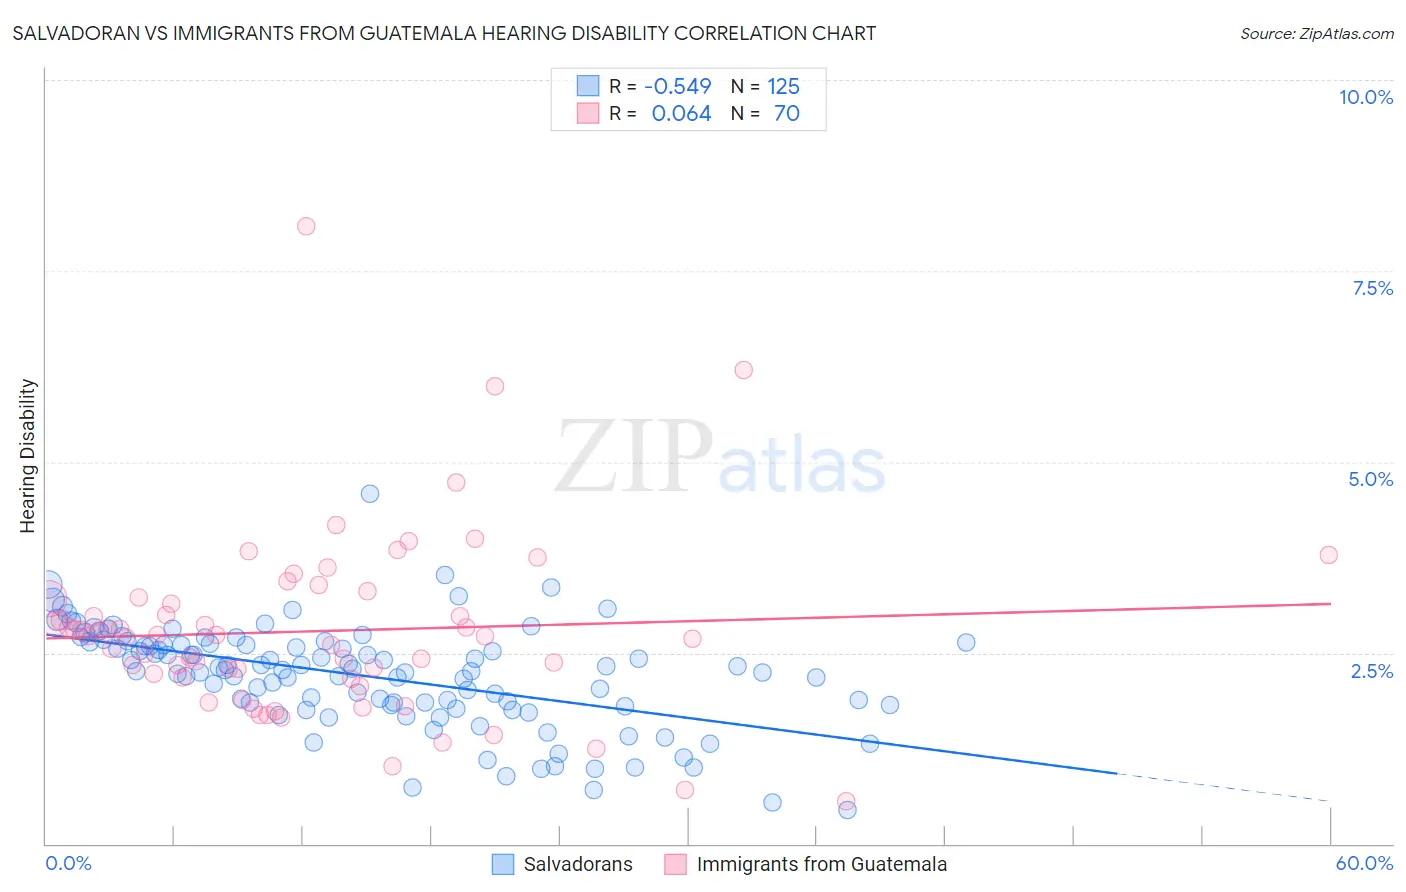
Salvadoran vs Immigrants from Guatemala Hearing Disability Correlation Chart
The statistical analysis conducted on geographies consisting of 398,804,647 people shows a substantial negative correlation between the proportion of Salvadorans and percentage of population with hearing disability in the United States with a correlation coefficient (R) of -0.549 and weighted average of 2.6%. Similarly, the statistical analysis conducted on geographies consisting of 377,187,532 people shows a slight positive correlation between the proportion of Immigrants from Guatemala and percentage of population with hearing disability in the United States with a correlation coefficient (R) of 0.064 and weighted average of 2.8%, a difference of 6.8%.
Hearing Disability Correlation Summary
| Measurement | Salvadoran | Immigrants from Guatemala |
| Minimum | 0.44% | 0.55% |
| Maximum | 4.6% | 8.1% |
| Range | 4.1% | 7.5% |
| Mean | 2.2% | 2.8% |
| Median | 2.3% | 2.7% |
| Interquartile 25% (IQ1) | 1.8% | 2.2% |
| Interquartile 75% (IQ3) | 2.6% | 3.2% |
| Interquartile Range (IQR) | 0.81% | 1.0% |
| Standard Deviation (Sample) | 0.67% | 1.2% |
| Standard Deviation (Population) | 0.67% | 1.2% |
Similar Demographics by Hearing Disability
Demographics Similar to Salvadorans by Hearing Disability
In terms of hearing disability, the demographic groups most similar to Salvadorans are Immigrants from Pakistan (2.6%, a difference of 0.12%), Filipino (2.6%, a difference of 0.16%), Okinawan (2.6%, a difference of 0.22%), Immigrants from Western Africa (2.6%, a difference of 0.25%), and Immigrants from Jamaica (2.6%, a difference of 0.33%).
| Demographics | Rating | Rank | Hearing Disability |
| Immigrants | Haiti | 99.7 /100 | #28 | Exceptional 2.6% |
| Bolivians | 99.7 /100 | #29 | Exceptional 2.6% |
| Immigrants | Caribbean | 99.7 /100 | #30 | Exceptional 2.6% |
| Immigrants | Cameroon | 99.7 /100 | #31 | Exceptional 2.6% |
| Immigrants | Venezuela | 99.7 /100 | #32 | Exceptional 2.6% |
| Filipinos | 99.6 /100 | #33 | Exceptional 2.6% |
| Immigrants | Pakistan | 99.6 /100 | #34 | Exceptional 2.6% |
| Salvadorans | 99.6 /100 | #35 | Exceptional 2.6% |
| Okinawans | 99.6 /100 | #36 | Exceptional 2.6% |
| Immigrants | Western Africa | 99.6 /100 | #37 | Exceptional 2.6% |
| Immigrants | Jamaica | 99.5 /100 | #38 | Exceptional 2.6% |
| Immigrants | China | 99.5 /100 | #39 | Exceptional 2.6% |
| Haitians | 99.5 /100 | #40 | Exceptional 2.6% |
| Immigrants | Taiwan | 99.4 /100 | #41 | Exceptional 2.6% |
| West Indians | 99.4 /100 | #42 | Exceptional 2.6% |
Demographics Similar to Immigrants from Guatemala by Hearing Disability
In terms of hearing disability, the demographic groups most similar to Immigrants from Guatemala are Immigrants from Honduras (2.8%, a difference of 0.040%), Immigrants from Eastern Africa (2.8%, a difference of 0.050%), Immigrants from Afghanistan (2.8%, a difference of 0.10%), Immigrants from Spain (2.8%, a difference of 0.11%), and Taiwanese (2.8%, a difference of 0.12%).
| Demographics | Rating | Rank | Hearing Disability |
| Iranians | 96.4 /100 | #92 | Exceptional 2.8% |
| Immigrants | Kuwait | 96.3 /100 | #93 | Exceptional 2.8% |
| Uruguayans | 95.9 /100 | #94 | Exceptional 2.8% |
| Israelis | 95.9 /100 | #95 | Exceptional 2.8% |
| Immigrants | Somalia | 95.5 /100 | #96 | Exceptional 2.8% |
| Immigrants | Afghanistan | 95.3 /100 | #97 | Exceptional 2.8% |
| Immigrants | Honduras | 95.1 /100 | #98 | Exceptional 2.8% |
| Immigrants | Guatemala | 95.1 /100 | #99 | Exceptional 2.8% |
| Immigrants | Eastern Africa | 95.0 /100 | #100 | Exceptional 2.8% |
| Immigrants | Spain | 94.9 /100 | #101 | Exceptional 2.8% |
| Taiwanese | 94.8 /100 | #102 | Exceptional 2.8% |
| Immigrants | Indonesia | 94.7 /100 | #103 | Exceptional 2.8% |
| Burmese | 94.2 /100 | #104 | Exceptional 2.8% |
| Moroccans | 93.9 /100 | #105 | Exceptional 2.8% |
| Hondurans | 93.4 /100 | #106 | Exceptional 2.8% |