Salvadoran vs Danish Hearing Disability
COMPARE
Salvadoran
Danish
Hearing Disability
Hearing Disability Comparison
Salvadorans
Danes
2.6%
HEARING DISABILITY
99.6/ 100
METRIC RATING
35th/ 347
METRIC RANK
3.6%
HEARING DISABILITY
0.0/ 100
METRIC RATING
276th/ 347
METRIC RANK
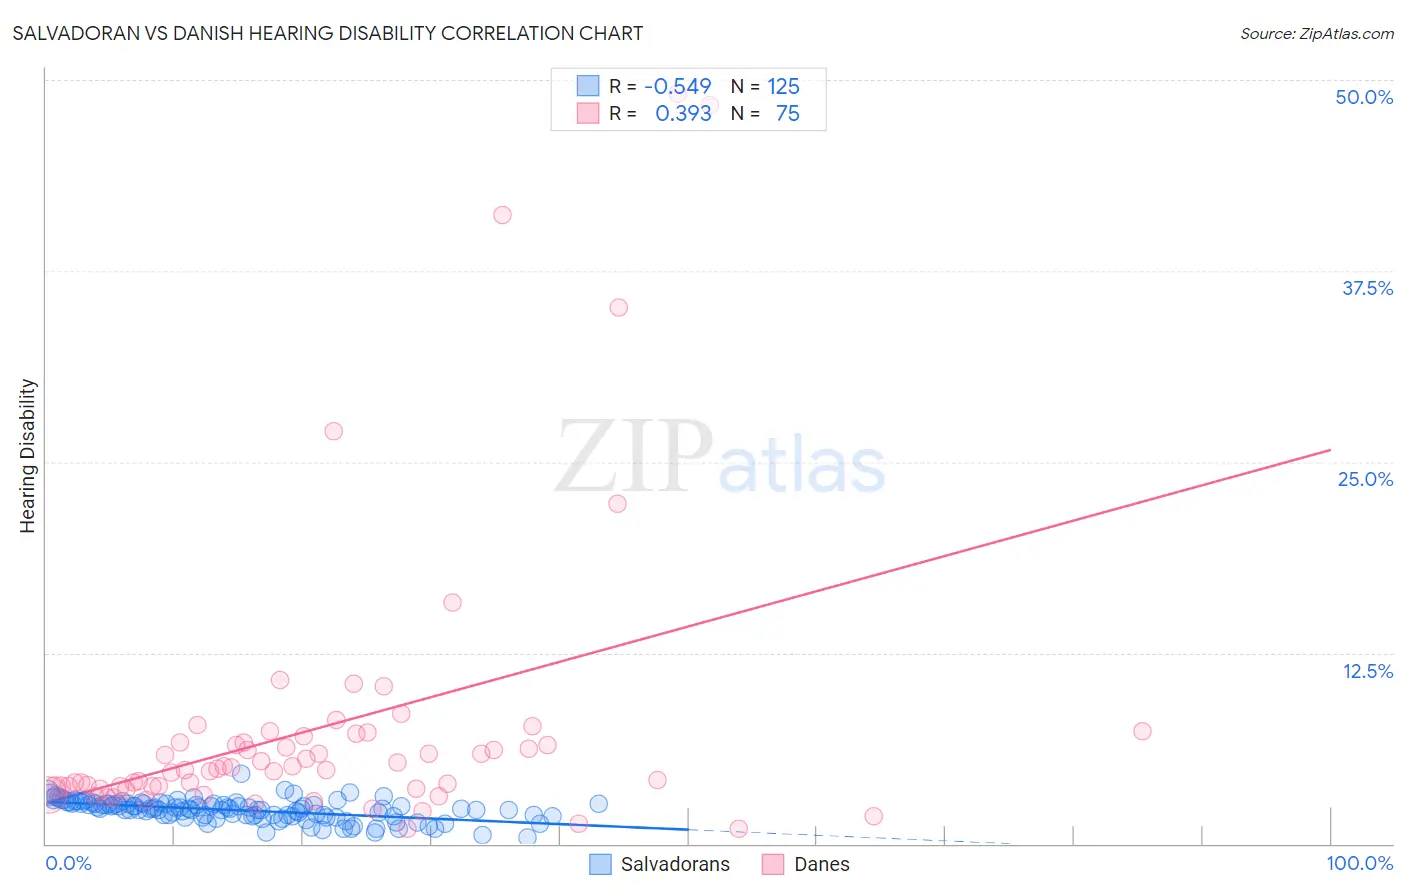
Salvadoran vs Danish Hearing Disability Correlation Chart
The statistical analysis conducted on geographies consisting of 398,804,647 people shows a substantial negative correlation between the proportion of Salvadorans and percentage of population with hearing disability in the United States with a correlation coefficient (R) of -0.549 and weighted average of 2.6%. Similarly, the statistical analysis conducted on geographies consisting of 473,961,057 people shows a mild positive correlation between the proportion of Danes and percentage of population with hearing disability in the United States with a correlation coefficient (R) of 0.393 and weighted average of 3.6%, a difference of 36.3%.
Hearing Disability Correlation Summary
| Measurement | Salvadoran | Danish |
| Minimum | 0.44% | 0.96% |
| Maximum | 4.6% | 49.1% |
| Range | 4.1% | 48.2% |
| Mean | 2.2% | 7.7% |
| Median | 2.3% | 4.9% |
| Interquartile 25% (IQ1) | 1.8% | 3.7% |
| Interquartile 75% (IQ3) | 2.6% | 7.1% |
| Interquartile Range (IQR) | 0.81% | 3.4% |
| Standard Deviation (Sample) | 0.67% | 9.5% |
| Standard Deviation (Population) | 0.67% | 9.5% |
Similar Demographics by Hearing Disability
Demographics Similar to Salvadorans by Hearing Disability
In terms of hearing disability, the demographic groups most similar to Salvadorans are Immigrants from Pakistan (2.6%, a difference of 0.12%), Filipino (2.6%, a difference of 0.16%), Okinawan (2.6%, a difference of 0.22%), Immigrants from Western Africa (2.6%, a difference of 0.25%), and Immigrants from Jamaica (2.6%, a difference of 0.33%).
| Demographics | Rating | Rank | Hearing Disability |
| Immigrants | Haiti | 99.7 /100 | #28 | Exceptional 2.6% |
| Bolivians | 99.7 /100 | #29 | Exceptional 2.6% |
| Immigrants | Caribbean | 99.7 /100 | #30 | Exceptional 2.6% |
| Immigrants | Cameroon | 99.7 /100 | #31 | Exceptional 2.6% |
| Immigrants | Venezuela | 99.7 /100 | #32 | Exceptional 2.6% |
| Filipinos | 99.6 /100 | #33 | Exceptional 2.6% |
| Immigrants | Pakistan | 99.6 /100 | #34 | Exceptional 2.6% |
| Salvadorans | 99.6 /100 | #35 | Exceptional 2.6% |
| Okinawans | 99.6 /100 | #36 | Exceptional 2.6% |
| Immigrants | Western Africa | 99.6 /100 | #37 | Exceptional 2.6% |
| Immigrants | Jamaica | 99.5 /100 | #38 | Exceptional 2.6% |
| Immigrants | China | 99.5 /100 | #39 | Exceptional 2.6% |
| Haitians | 99.5 /100 | #40 | Exceptional 2.6% |
| Immigrants | Taiwan | 99.4 /100 | #41 | Exceptional 2.6% |
| West Indians | 99.4 /100 | #42 | Exceptional 2.6% |
Demographics Similar to Danes by Hearing Disability
In terms of hearing disability, the demographic groups most similar to Danes are Czechoslovakian (3.6%, a difference of 0.12%), Swiss (3.5%, a difference of 0.32%), Puerto Rican (3.5%, a difference of 0.64%), Nonimmigrants (3.6%, a difference of 0.70%), and Fijian (3.5%, a difference of 0.72%).
| Demographics | Rating | Rank | Hearing Disability |
| Ute | 0.1 /100 | #269 | Tragic 3.5% |
| Europeans | 0.1 /100 | #270 | Tragic 3.5% |
| Czechs | 0.1 /100 | #271 | Tragic 3.5% |
| Fijians | 0.0 /100 | #272 | Tragic 3.5% |
| Puerto Ricans | 0.0 /100 | #273 | Tragic 3.5% |
| Swiss | 0.0 /100 | #274 | Tragic 3.5% |
| Czechoslovakians | 0.0 /100 | #275 | Tragic 3.6% |
| Danes | 0.0 /100 | #276 | Tragic 3.6% |
| Immigrants | Nonimmigrants | 0.0 /100 | #277 | Tragic 3.6% |
| Basques | 0.0 /100 | #278 | Tragic 3.6% |
| Slovaks | 0.0 /100 | #279 | Tragic 3.6% |
| French American Indians | 0.0 /100 | #280 | Tragic 3.6% |
| Scandinavians | 0.0 /100 | #281 | Tragic 3.6% |
| Swedes | 0.0 /100 | #282 | Tragic 3.6% |
| Blackfeet | 0.0 /100 | #283 | Tragic 3.6% |