Salvadoran vs Kenyan Single Male Poverty
COMPARE
Salvadoran
Kenyan
Single Male Poverty
Single Male Poverty Comparison
Salvadorans
Kenyans
12.5%
SINGLE MALE POVERTY
83.7/ 100
METRIC RATING
132nd/ 347
METRIC RANK
12.4%
SINGLE MALE POVERTY
93.3/ 100
METRIC RATING
112th/ 347
METRIC RANK
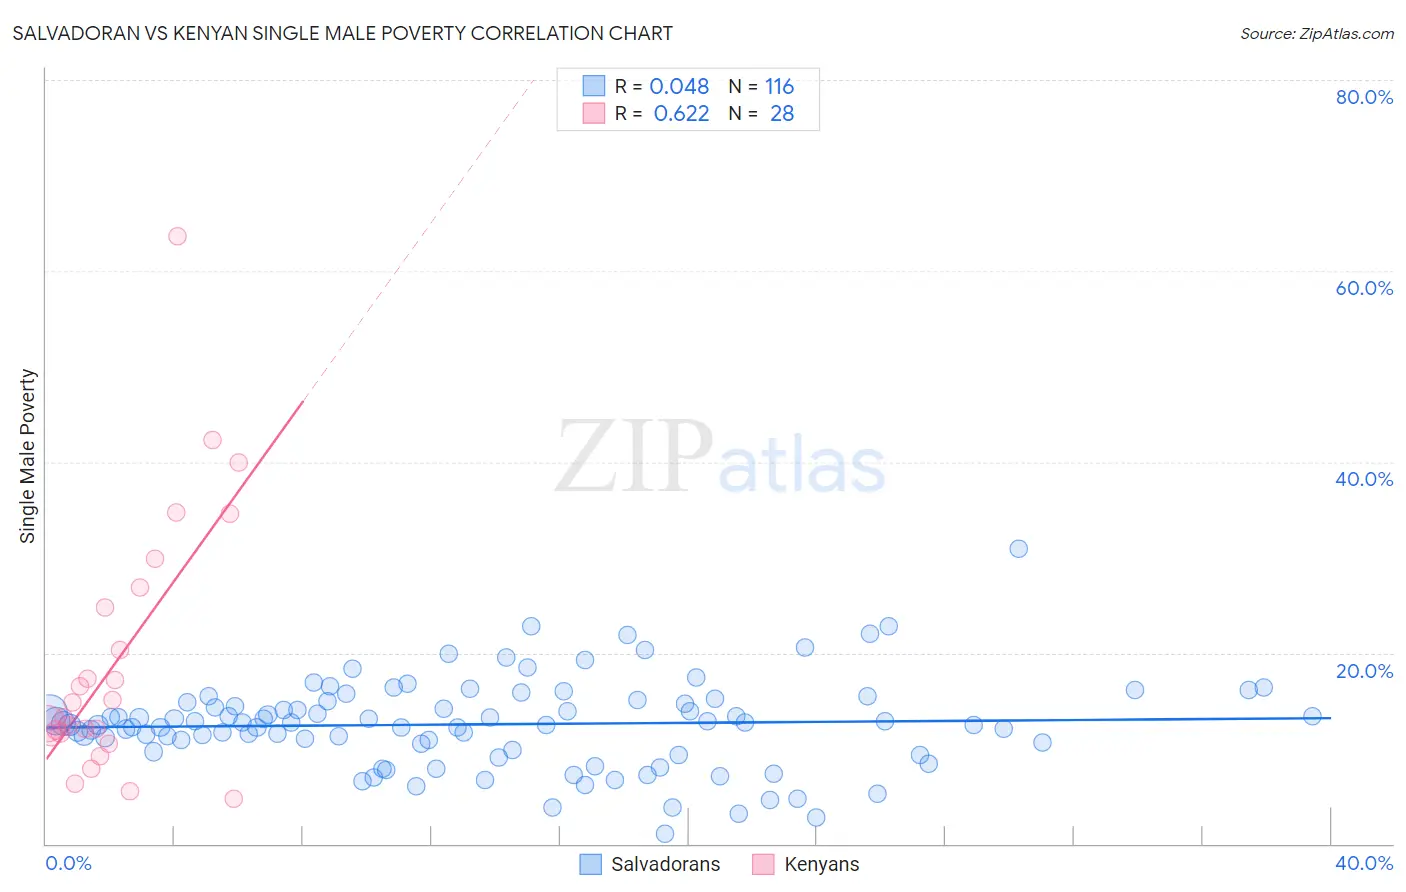
Salvadoran vs Kenyan Single Male Poverty Correlation Chart
The statistical analysis conducted on geographies consisting of 358,837,331 people shows no correlation between the proportion of Salvadorans and poverty level among single males in the United States with a correlation coefficient (R) of 0.048 and weighted average of 12.5%. Similarly, the statistical analysis conducted on geographies consisting of 158,530,419 people shows a significant positive correlation between the proportion of Kenyans and poverty level among single males in the United States with a correlation coefficient (R) of 0.622 and weighted average of 12.4%, a difference of 1.4%.
Single Male Poverty Correlation Summary
| Measurement | Salvadoran | Kenyan |
| Minimum | 1.0% | 4.8% |
| Maximum | 30.9% | 63.6% |
| Range | 29.9% | 58.9% |
| Mean | 12.5% | 19.3% |
| Median | 12.6% | 14.0% |
| Interquartile 25% (IQ1) | 10.2% | 11.5% |
| Interquartile 75% (IQ3) | 14.9% | 25.8% |
| Interquartile Range (IQR) | 4.7% | 14.3% |
| Standard Deviation (Sample) | 4.7% | 13.5% |
| Standard Deviation (Population) | 4.6% | 13.3% |
Demographics Similar to Salvadorans and Kenyans by Single Male Poverty
In terms of single male poverty, the demographic groups most similar to Salvadorans are Immigrants from Northern Europe (12.5%, a difference of 0.0%), Immigrants from Nicaragua (12.5%, a difference of 0.12%), Immigrants from Sierra Leone (12.5%, a difference of 0.19%), Ecuadorian (12.5%, a difference of 0.23%), and Immigrants from Netherlands (12.5%, a difference of 0.27%). Similarly, the demographic groups most similar to Kenyans are Pakistani (12.4%, a difference of 0.19%), Nicaraguan (12.4%, a difference of 0.23%), Immigrants from Southern Europe (12.4%, a difference of 0.34%), Immigrants from Syria (12.4%, a difference of 0.40%), and Immigrants from Oceania (12.4%, a difference of 0.41%).
| Demographics | Rating | Rank | Single Male Poverty |
| Kenyans | 93.3 /100 | #112 | Exceptional 12.4% |
| Pakistanis | 92.4 /100 | #113 | Exceptional 12.4% |
| Nicaraguans | 92.1 /100 | #114 | Exceptional 12.4% |
| Immigrants | Southern Europe | 91.5 /100 | #115 | Exceptional 12.4% |
| Immigrants | Syria | 91.2 /100 | #116 | Exceptional 12.4% |
| Immigrants | Oceania | 91.1 /100 | #117 | Exceptional 12.4% |
| Albanians | 90.6 /100 | #118 | Exceptional 12.4% |
| Immigrants | Albania | 90.3 /100 | #119 | Exceptional 12.4% |
| Venezuelans | 89.4 /100 | #120 | Excellent 12.4% |
| Icelanders | 88.2 /100 | #121 | Excellent 12.5% |
| Serbians | 87.9 /100 | #122 | Excellent 12.5% |
| Immigrants | Kenya | 87.6 /100 | #123 | Excellent 12.5% |
| Russians | 87.3 /100 | #124 | Excellent 12.5% |
| Immigrants | Jordan | 87.1 /100 | #125 | Excellent 12.5% |
| Romanians | 86.4 /100 | #126 | Excellent 12.5% |
| Immigrants | Netherlands | 86.2 /100 | #127 | Excellent 12.5% |
| Ecuadorians | 85.9 /100 | #128 | Excellent 12.5% |
| Immigrants | Sierra Leone | 85.5 /100 | #129 | Excellent 12.5% |
| Immigrants | Nicaragua | 84.8 /100 | #130 | Excellent 12.5% |
| Immigrants | Northern Europe | 83.7 /100 | #131 | Excellent 12.5% |
| Salvadorans | 83.7 /100 | #132 | Excellent 12.5% |