Russian vs Immigrants from Guatemala 7th Grade
COMPARE
Russian
Immigrants from Guatemala
7th Grade
7th Grade Comparison
Russians
Immigrants from Guatemala
97.0%
7TH GRADE
99.8/ 100
METRIC RATING
55th/ 347
METRIC RANK
91.3%
7TH GRADE
0.0/ 100
METRIC RATING
343rd/ 347
METRIC RANK
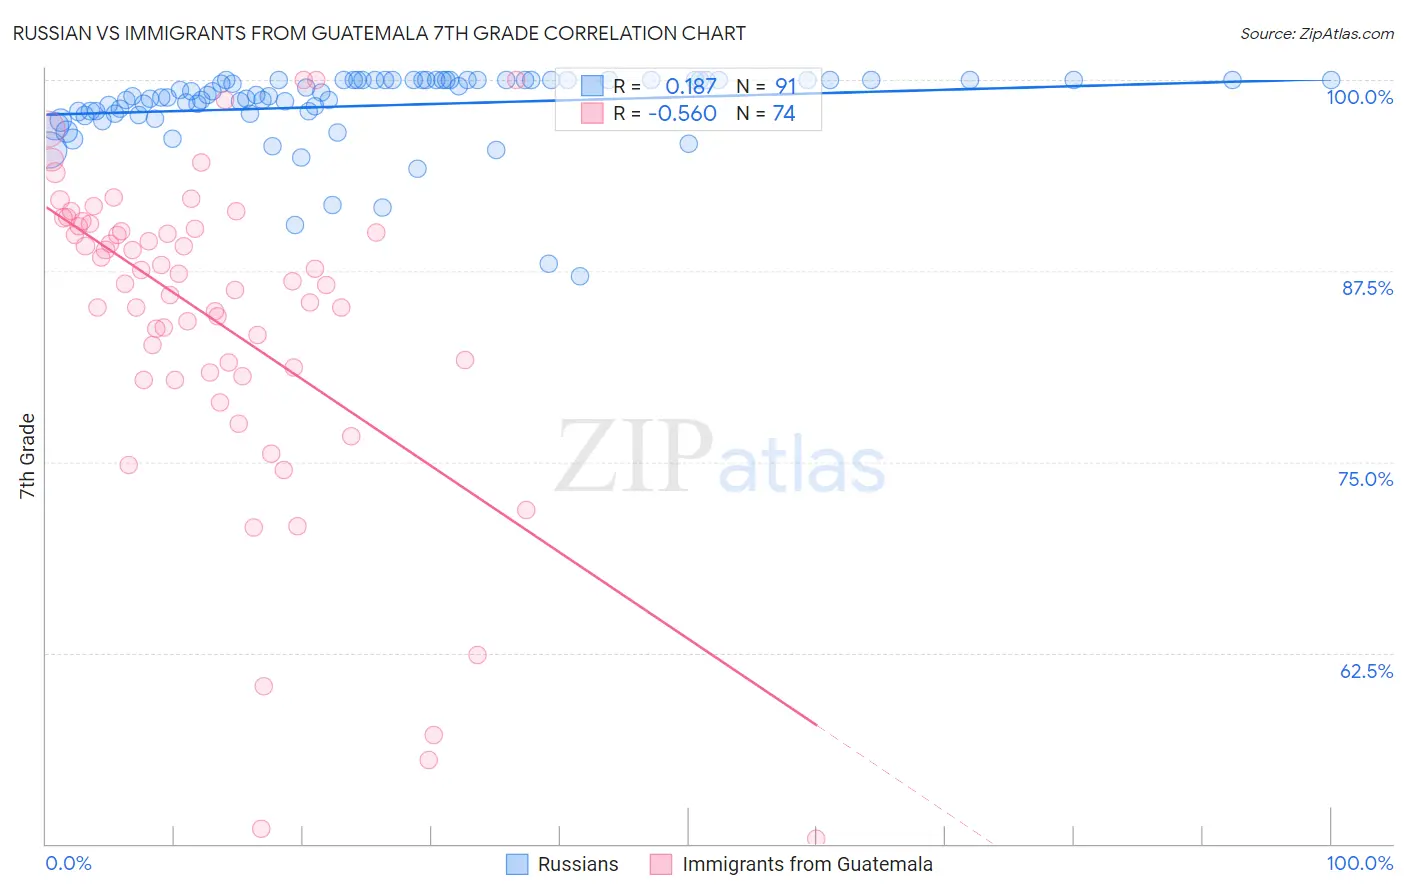
Russian vs Immigrants from Guatemala 7th Grade Correlation Chart
The statistical analysis conducted on geographies consisting of 512,259,047 people shows a poor positive correlation between the proportion of Russians and percentage of population with at least 7th grade education in the United States with a correlation coefficient (R) of 0.187 and weighted average of 97.0%. Similarly, the statistical analysis conducted on geographies consisting of 377,286,142 people shows a substantial negative correlation between the proportion of Immigrants from Guatemala and percentage of population with at least 7th grade education in the United States with a correlation coefficient (R) of -0.560 and weighted average of 91.3%, a difference of 6.2%.
7th Grade Correlation Summary
| Measurement | Russian | Immigrants from Guatemala |
| Minimum | 87.1% | 50.3% |
| Maximum | 100.0% | 100.0% |
| Range | 12.9% | 49.7% |
| Mean | 98.3% | 84.2% |
| Median | 99.0% | 86.7% |
| Interquartile 25% (IQ1) | 97.8% | 80.8% |
| Interquartile 75% (IQ3) | 100.0% | 90.5% |
| Interquartile Range (IQR) | 2.2% | 9.6% |
| Standard Deviation (Sample) | 2.5% | 10.7% |
| Standard Deviation (Population) | 2.5% | 10.6% |
Similar Demographics by 7th Grade
Demographics Similar to Russians by 7th Grade
In terms of 7th grade, the demographic groups most similar to Russians are Serbian (97.0%, a difference of 0.0%), American (97.0%, a difference of 0.0%), Australian (97.0%, a difference of 0.010%), White/Caucasian (97.0%, a difference of 0.020%), and Macedonian (97.0%, a difference of 0.020%).
| Demographics | Rating | Rank | 7th Grade |
| Celtics | 99.9 /100 | #48 | Exceptional 97.1% |
| Slavs | 99.9 /100 | #49 | Exceptional 97.1% |
| Immigrants | Scotland | 99.9 /100 | #50 | Exceptional 97.1% |
| Estonians | 99.9 /100 | #51 | Exceptional 97.0% |
| Greeks | 99.9 /100 | #52 | Exceptional 97.0% |
| Austrians | 99.8 /100 | #53 | Exceptional 97.0% |
| Australians | 99.8 /100 | #54 | Exceptional 97.0% |
| Russians | 99.8 /100 | #55 | Exceptional 97.0% |
| Serbians | 99.8 /100 | #56 | Exceptional 97.0% |
| Americans | 99.8 /100 | #57 | Exceptional 97.0% |
| Whites/Caucasians | 99.8 /100 | #58 | Exceptional 97.0% |
| Macedonians | 99.8 /100 | #59 | Exceptional 97.0% |
| Immigrants | Canada | 99.8 /100 | #60 | Exceptional 96.9% |
| Creek | 99.8 /100 | #61 | Exceptional 96.9% |
| Immigrants | North America | 99.8 /100 | #62 | Exceptional 96.9% |
Demographics Similar to Immigrants from Guatemala by 7th Grade
In terms of 7th grade, the demographic groups most similar to Immigrants from Guatemala are Salvadoran (91.5%, a difference of 0.16%), Immigrants from Central America (91.0%, a difference of 0.36%), Guatemalan (91.7%, a difference of 0.43%), Immigrants from El Salvador (90.9%, a difference of 0.43%), and Yakama (91.7%, a difference of 0.45%).
| Demographics | Rating | Rank | 7th Grade |
| Immigrants | Armenia | 0.0 /100 | #333 | Tragic 92.7% |
| Immigrants | Yemen | 0.0 /100 | #334 | Tragic 92.6% |
| Mexican American Indians | 0.0 /100 | #335 | Tragic 92.6% |
| Immigrants | Honduras | 0.0 /100 | #336 | Tragic 92.5% |
| Immigrants | Latin America | 0.0 /100 | #337 | Tragic 92.2% |
| Central Americans | 0.0 /100 | #338 | Tragic 92.1% |
| Mexicans | 0.0 /100 | #339 | Tragic 91.9% |
| Yakama | 0.0 /100 | #340 | Tragic 91.7% |
| Guatemalans | 0.0 /100 | #341 | Tragic 91.7% |
| Salvadorans | 0.0 /100 | #342 | Tragic 91.5% |
| Immigrants | Guatemala | 0.0 /100 | #343 | Tragic 91.3% |
| Immigrants | Central America | 0.0 /100 | #344 | Tragic 91.0% |
| Immigrants | El Salvador | 0.0 /100 | #345 | Tragic 90.9% |
| Immigrants | Mexico | 0.0 /100 | #346 | Tragic 90.7% |
| Spanish American Indians | 0.0 /100 | #347 | Tragic 90.3% |