Russian vs Immigrants from Guatemala Currently Married
COMPARE
Russian
Immigrants from Guatemala
Currently Married
Currently Married Comparison
Russians
Immigrants from Guatemala
48.6%
CURRENTLY MARRIED
98.9/ 100
METRIC RATING
52nd/ 347
METRIC RANK
42.6%
CURRENTLY MARRIED
0.0/ 100
METRIC RATING
291st/ 347
METRIC RANK
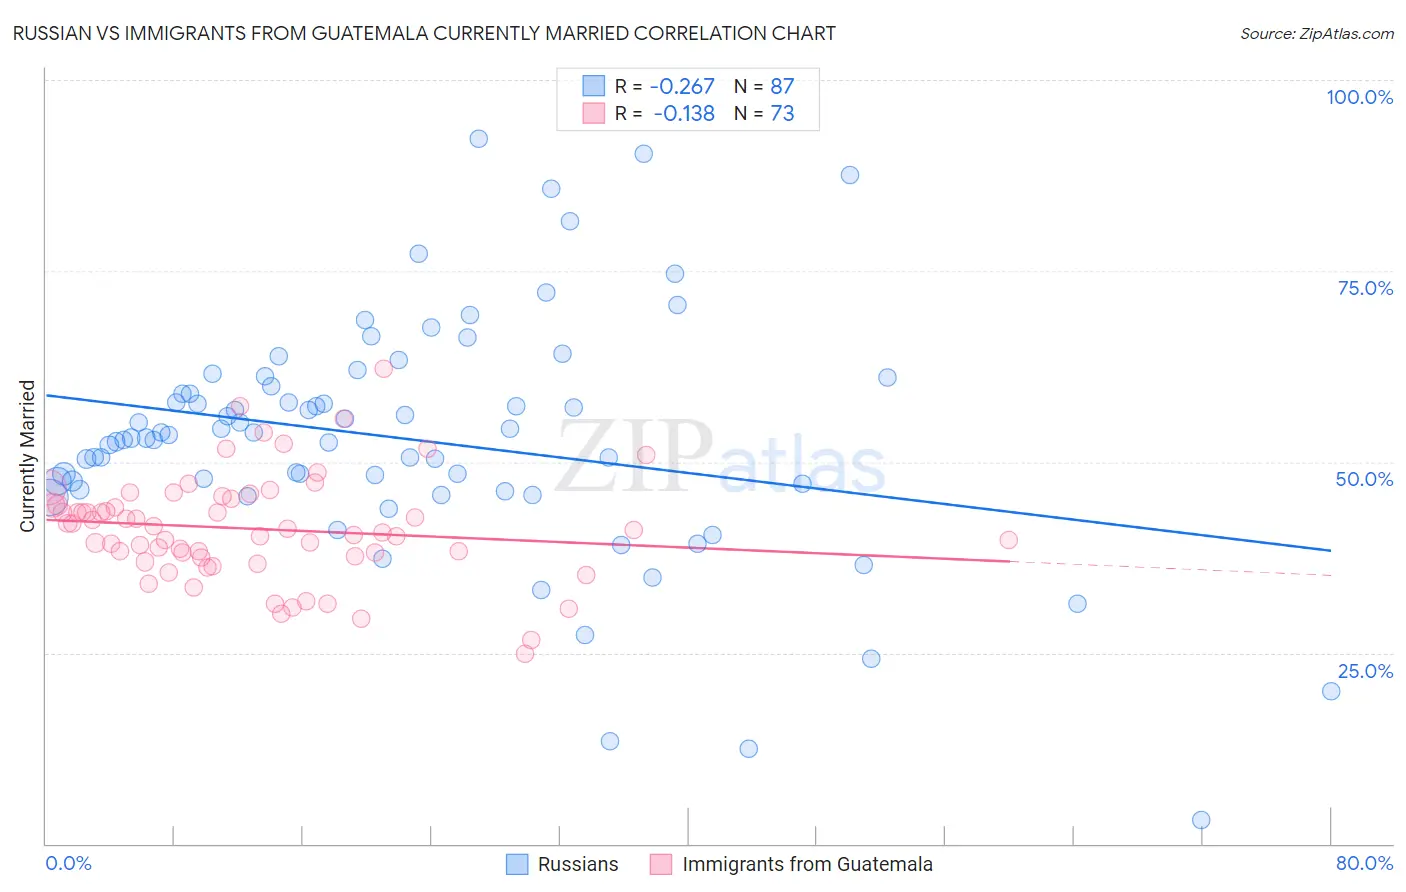
Russian vs Immigrants from Guatemala Currently Married Correlation Chart
The statistical analysis conducted on geographies consisting of 512,168,988 people shows a weak negative correlation between the proportion of Russians and percentage of population currently married in the United States with a correlation coefficient (R) of -0.267 and weighted average of 48.6%. Similarly, the statistical analysis conducted on geographies consisting of 377,254,434 people shows a poor negative correlation between the proportion of Immigrants from Guatemala and percentage of population currently married in the United States with a correlation coefficient (R) of -0.138 and weighted average of 42.6%, a difference of 13.9%.
Currently Married Correlation Summary
| Measurement | Russian | Immigrants from Guatemala |
| Minimum | 3.1% | 24.9% |
| Maximum | 92.3% | 62.2% |
| Range | 89.2% | 37.3% |
| Mean | 52.9% | 41.2% |
| Median | 53.1% | 41.0% |
| Interquartile 25% (IQ1) | 46.3% | 37.6% |
| Interquartile 75% (IQ3) | 59.8% | 44.7% |
| Interquartile Range (IQR) | 13.5% | 7.1% |
| Standard Deviation (Sample) | 15.7% | 6.9% |
| Standard Deviation (Population) | 15.6% | 6.9% |
Similar Demographics by Currently Married
Demographics Similar to Russians by Currently Married
In terms of currently married, the demographic groups most similar to Russians are Iranian (48.6%, a difference of 0.090%), White/Caucasian (48.6%, a difference of 0.090%), Immigrants from Austria (48.5%, a difference of 0.12%), Bhutanese (48.6%, a difference of 0.16%), and Immigrants from Moldova (48.5%, a difference of 0.18%).
| Demographics | Rating | Rank | Currently Married |
| Belgians | 99.3 /100 | #45 | Exceptional 48.7% |
| Immigrants | Iran | 99.2 /100 | #46 | Exceptional 48.7% |
| Northern Europeans | 99.2 /100 | #47 | Exceptional 48.7% |
| Austrians | 99.2 /100 | #48 | Exceptional 48.7% |
| Bhutanese | 99.1 /100 | #49 | Exceptional 48.6% |
| Iranians | 99.0 /100 | #50 | Exceptional 48.6% |
| Whites/Caucasians | 99.0 /100 | #51 | Exceptional 48.6% |
| Russians | 98.9 /100 | #52 | Exceptional 48.6% |
| Immigrants | Austria | 98.8 /100 | #53 | Exceptional 48.5% |
| Immigrants | Moldova | 98.7 /100 | #54 | Exceptional 48.5% |
| Immigrants | North Macedonia | 98.7 /100 | #55 | Exceptional 48.5% |
| Latvians | 98.7 /100 | #56 | Exceptional 48.5% |
| Immigrants | Netherlands | 98.6 /100 | #57 | Exceptional 48.5% |
| French | 98.6 /100 | #58 | Exceptional 48.4% |
| Immigrants | Ireland | 98.5 /100 | #59 | Exceptional 48.4% |
Demographics Similar to Immigrants from Guatemala by Currently Married
In terms of currently married, the demographic groups most similar to Immigrants from Guatemala are Paiute (42.7%, a difference of 0.12%), Immigrants from Ghana (42.7%, a difference of 0.12%), Subsaharan African (42.6%, a difference of 0.16%), Yuman (42.6%, a difference of 0.18%), and Honduran (42.5%, a difference of 0.30%).
| Demographics | Rating | Rank | Currently Married |
| Immigrants | El Salvador | 0.0 /100 | #284 | Tragic 43.1% |
| Immigrants | Middle Africa | 0.0 /100 | #285 | Tragic 43.0% |
| Ghanaians | 0.0 /100 | #286 | Tragic 42.9% |
| Guatemalans | 0.0 /100 | #287 | Tragic 42.9% |
| Natives/Alaskans | 0.0 /100 | #288 | Tragic 42.8% |
| Paiute | 0.0 /100 | #289 | Tragic 42.7% |
| Immigrants | Ghana | 0.0 /100 | #290 | Tragic 42.7% |
| Immigrants | Guatemala | 0.0 /100 | #291 | Tragic 42.6% |
| Sub-Saharan Africans | 0.0 /100 | #292 | Tragic 42.6% |
| Yuman | 0.0 /100 | #293 | Tragic 42.6% |
| Hondurans | 0.0 /100 | #294 | Tragic 42.5% |
| Immigrants | Western Africa | 0.0 /100 | #295 | Tragic 42.4% |
| Menominee | 0.0 /100 | #296 | Tragic 42.3% |
| Cheyenne | 0.0 /100 | #297 | Tragic 42.2% |
| Immigrants | Honduras | 0.0 /100 | #298 | Tragic 42.2% |