Immigrants from Northern Africa vs Houma Disability
COMPARE
Immigrants from Northern Africa
Houma
Disability
Disability Comparison
Immigrants from Northern Africa
Houma
10.9%
DISABILITY
99.7/ 100
METRIC RATING
62nd/ 347
METRIC RANK
17.1%
DISABILITY
0.0/ 100
METRIC RATING
347th/ 347
METRIC RANK
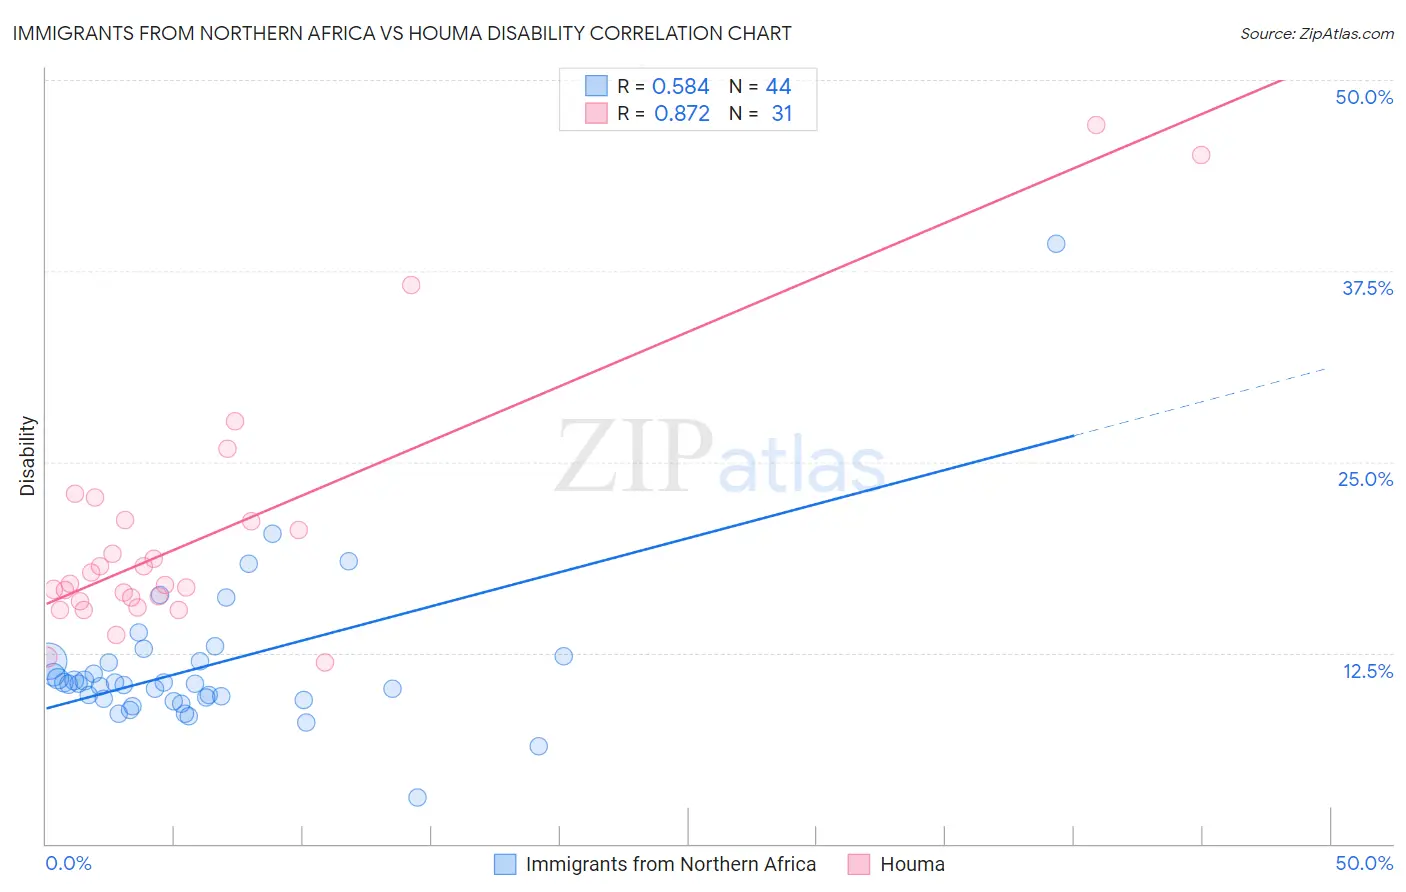
Immigrants from Northern Africa vs Houma Disability Correlation Chart
The statistical analysis conducted on geographies consisting of 321,190,304 people shows a substantial positive correlation between the proportion of Immigrants from Northern Africa and percentage of population with a disability in the United States with a correlation coefficient (R) of 0.584 and weighted average of 10.9%. Similarly, the statistical analysis conducted on geographies consisting of 36,799,095 people shows a very strong positive correlation between the proportion of Houma and percentage of population with a disability in the United States with a correlation coefficient (R) of 0.872 and weighted average of 17.1%, a difference of 56.6%.
Disability Correlation Summary
| Measurement | Immigrants from Northern Africa | Houma |
| Minimum | 3.0% | 11.9% |
| Maximum | 39.3% | 47.0% |
| Range | 36.3% | 35.2% |
| Mean | 11.6% | 20.3% |
| Median | 10.5% | 17.0% |
| Interquartile 25% (IQ1) | 9.4% | 15.9% |
| Interquartile 75% (IQ3) | 11.9% | 21.2% |
| Interquartile Range (IQR) | 2.5% | 5.3% |
| Standard Deviation (Sample) | 5.3% | 8.4% |
| Standard Deviation (Population) | 5.2% | 8.3% |
Similar Demographics by Disability
Demographics Similar to Immigrants from Northern Africa by Disability
In terms of disability, the demographic groups most similar to Immigrants from Northern Africa are Immigrants from Eritrea (11.0%, a difference of 0.020%), Immigrants from Bulgaria (10.9%, a difference of 0.040%), Zimbabwean (10.9%, a difference of 0.10%), Immigrants from Colombia (10.9%, a difference of 0.19%), and Immigrants from Sweden (11.0%, a difference of 0.20%).
| Demographics | Rating | Rank | Disability |
| Immigrants | El Salvador | 99.8 /100 | #55 | Exceptional 10.9% |
| Immigrants | Lithuania | 99.8 /100 | #56 | Exceptional 10.9% |
| Salvadorans | 99.8 /100 | #57 | Exceptional 10.9% |
| Immigrants | South America | 99.8 /100 | #58 | Exceptional 10.9% |
| Immigrants | Colombia | 99.7 /100 | #59 | Exceptional 10.9% |
| Zimbabweans | 99.7 /100 | #60 | Exceptional 10.9% |
| Immigrants | Bulgaria | 99.7 /100 | #61 | Exceptional 10.9% |
| Immigrants | Northern Africa | 99.7 /100 | #62 | Exceptional 10.9% |
| Immigrants | Eritrea | 99.7 /100 | #63 | Exceptional 11.0% |
| Immigrants | Sweden | 99.6 /100 | #64 | Exceptional 11.0% |
| Bulgarians | 99.6 /100 | #65 | Exceptional 11.0% |
| Laotians | 99.6 /100 | #66 | Exceptional 11.0% |
| Colombians | 99.6 /100 | #67 | Exceptional 11.0% |
| Immigrants | Afghanistan | 99.6 /100 | #68 | Exceptional 11.0% |
| Sri Lankans | 99.5 /100 | #69 | Exceptional 11.0% |
Demographics Similar to Houma by Disability
In terms of disability, the demographic groups most similar to Houma are Tsimshian (16.1%, a difference of 6.2%), Puerto Rican (16.1%, a difference of 6.4%), Colville (15.8%, a difference of 8.6%), Creek (15.6%, a difference of 9.9%), and Kiowa (15.6%, a difference of 9.9%).
| Demographics | Rating | Rank | Disability |
| Cajuns | 0.0 /100 | #333 | Tragic 14.6% |
| Yuman | 0.0 /100 | #334 | Tragic 14.6% |
| Tohono O'odham | 0.0 /100 | #335 | Tragic 14.8% |
| Cherokee | 0.0 /100 | #336 | Tragic 14.8% |
| Seminole | 0.0 /100 | #337 | Tragic 14.9% |
| Dutch West Indians | 0.0 /100 | #338 | Tragic 14.9% |
| Chickasaw | 0.0 /100 | #339 | Tragic 15.2% |
| Choctaw | 0.0 /100 | #340 | Tragic 15.4% |
| Lumbee | 0.0 /100 | #341 | Tragic 15.5% |
| Kiowa | 0.0 /100 | #342 | Tragic 15.6% |
| Creek | 0.0 /100 | #343 | Tragic 15.6% |
| Colville | 0.0 /100 | #344 | Tragic 15.8% |
| Puerto Ricans | 0.0 /100 | #345 | Tragic 16.1% |
| Tsimshian | 0.0 /100 | #346 | Tragic 16.1% |
| Houma | 0.0 /100 | #347 | Tragic 17.1% |