Uruguayan vs Finnish Vision Disability
COMPARE
Uruguayan
Finnish
Vision Disability
Vision Disability Comparison
Uruguayans
Finns
2.2%
VISION DISABILITY
42.7/ 100
METRIC RATING
180th/ 347
METRIC RANK
2.1%
VISION DISABILITY
78.3/ 100
METRIC RATING
148th/ 347
METRIC RANK
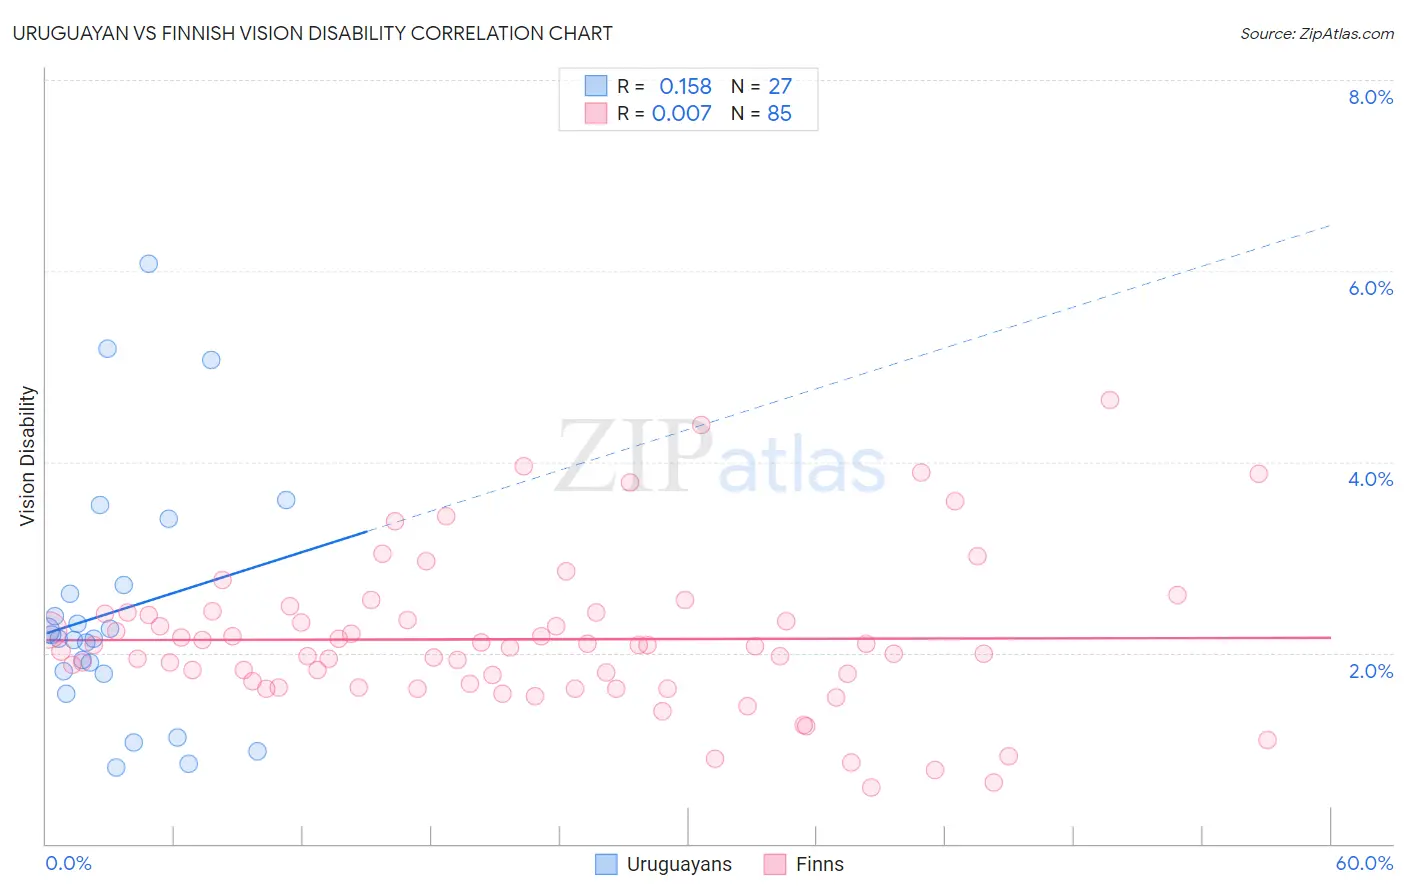
Uruguayan vs Finnish Vision Disability Correlation Chart
The statistical analysis conducted on geographies consisting of 144,772,408 people shows a poor positive correlation between the proportion of Uruguayans and percentage of population with vision disability in the United States with a correlation coefficient (R) of 0.158 and weighted average of 2.2%. Similarly, the statistical analysis conducted on geographies consisting of 404,250,677 people shows no correlation between the proportion of Finns and percentage of population with vision disability in the United States with a correlation coefficient (R) of 0.007 and weighted average of 2.1%, a difference of 2.5%.
Vision Disability Correlation Summary
| Measurement | Uruguayan | Finnish |
| Minimum | 0.80% | 0.59% |
| Maximum | 6.1% | 4.6% |
| Range | 5.3% | 4.0% |
| Mean | 2.4% | 2.1% |
| Median | 2.1% | 2.1% |
| Interquartile 25% (IQ1) | 1.8% | 1.7% |
| Interquartile 75% (IQ3) | 2.7% | 2.4% |
| Interquartile Range (IQR) | 0.93% | 0.76% |
| Standard Deviation (Sample) | 1.3% | 0.79% |
| Standard Deviation (Population) | 1.3% | 0.79% |
Similar Demographics by Vision Disability
Demographics Similar to Uruguayans by Vision Disability
In terms of vision disability, the demographic groups most similar to Uruguayans are Immigrants from Western Europe (2.2%, a difference of 0.10%), Immigrants from North America (2.2%, a difference of 0.12%), Costa Rican (2.2%, a difference of 0.13%), Immigrants from Oceania (2.2%, a difference of 0.16%), and Slavic (2.2%, a difference of 0.21%).
| Demographics | Rating | Rank | Vision Disability |
| Scandinavians | 50.0 /100 | #173 | Average 2.2% |
| Immigrants | Canada | 50.0 /100 | #174 | Average 2.2% |
| Immigrants | Fiji | 47.6 /100 | #175 | Average 2.2% |
| Yugoslavians | 46.5 /100 | #176 | Average 2.2% |
| Slavs | 46.0 /100 | #177 | Average 2.2% |
| Immigrants | Oceania | 45.1 /100 | #178 | Average 2.2% |
| Immigrants | North America | 44.5 /100 | #179 | Average 2.2% |
| Uruguayans | 42.7 /100 | #180 | Average 2.2% |
| Immigrants | Western Europe | 41.1 /100 | #181 | Average 2.2% |
| Costa Ricans | 40.7 /100 | #182 | Average 2.2% |
| Immigrants | Burma/Myanmar | 37.9 /100 | #183 | Fair 2.2% |
| Moroccans | 35.4 /100 | #184 | Fair 2.2% |
| Immigrants | Middle Africa | 33.5 /100 | #185 | Fair 2.2% |
| Native Hawaiians | 33.3 /100 | #186 | Fair 2.2% |
| Immigrants | St. Vincent and the Grenadines | 30.3 /100 | #187 | Fair 2.2% |
Demographics Similar to Finns by Vision Disability
In terms of vision disability, the demographic groups most similar to Finns are Immigrants from Sudan (2.1%, a difference of 0.010%), Italian (2.1%, a difference of 0.14%), Colombian (2.1%, a difference of 0.19%), Belgian (2.1%, a difference of 0.22%), and Immigrants from Norway (2.1%, a difference of 0.25%).
| Demographics | Rating | Rank | Vision Disability |
| Sierra Leoneans | 84.1 /100 | #141 | Excellent 2.1% |
| South Americans | 82.8 /100 | #142 | Excellent 2.1% |
| Immigrants | Sierra Leone | 82.8 /100 | #143 | Excellent 2.1% |
| Ukrainians | 81.9 /100 | #144 | Excellent 2.1% |
| Immigrants | Bosnia and Herzegovina | 81.5 /100 | #145 | Excellent 2.1% |
| Italians | 79.7 /100 | #146 | Good 2.1% |
| Immigrants | Sudan | 78.4 /100 | #147 | Good 2.1% |
| Finns | 78.3 /100 | #148 | Good 2.1% |
| Colombians | 76.2 /100 | #149 | Good 2.1% |
| Belgians | 75.9 /100 | #150 | Good 2.1% |
| Immigrants | Norway | 75.5 /100 | #151 | Good 2.1% |
| Immigrants | Southern Europe | 74.6 /100 | #152 | Good 2.1% |
| Immigrants | South America | 73.8 /100 | #153 | Good 2.1% |
| Slovenes | 73.6 /100 | #154 | Good 2.1% |
| Immigrants | Colombia | 72.1 /100 | #155 | Good 2.1% |