Puget Sound Salish vs Scotch-Irish Median Male Earnings
COMPARE
Puget Sound Salish
Scotch-Irish
Median Male Earnings
Median Male Earnings Comparison
Puget Sound Salish
Scotch-Irish
$53,704
MEDIAN MALE EARNINGS
31.6/ 100
METRIC RATING
189th/ 347
METRIC RANK
$53,658
MEDIAN MALE EARNINGS
30.6/ 100
METRIC RATING
192nd/ 347
METRIC RANK
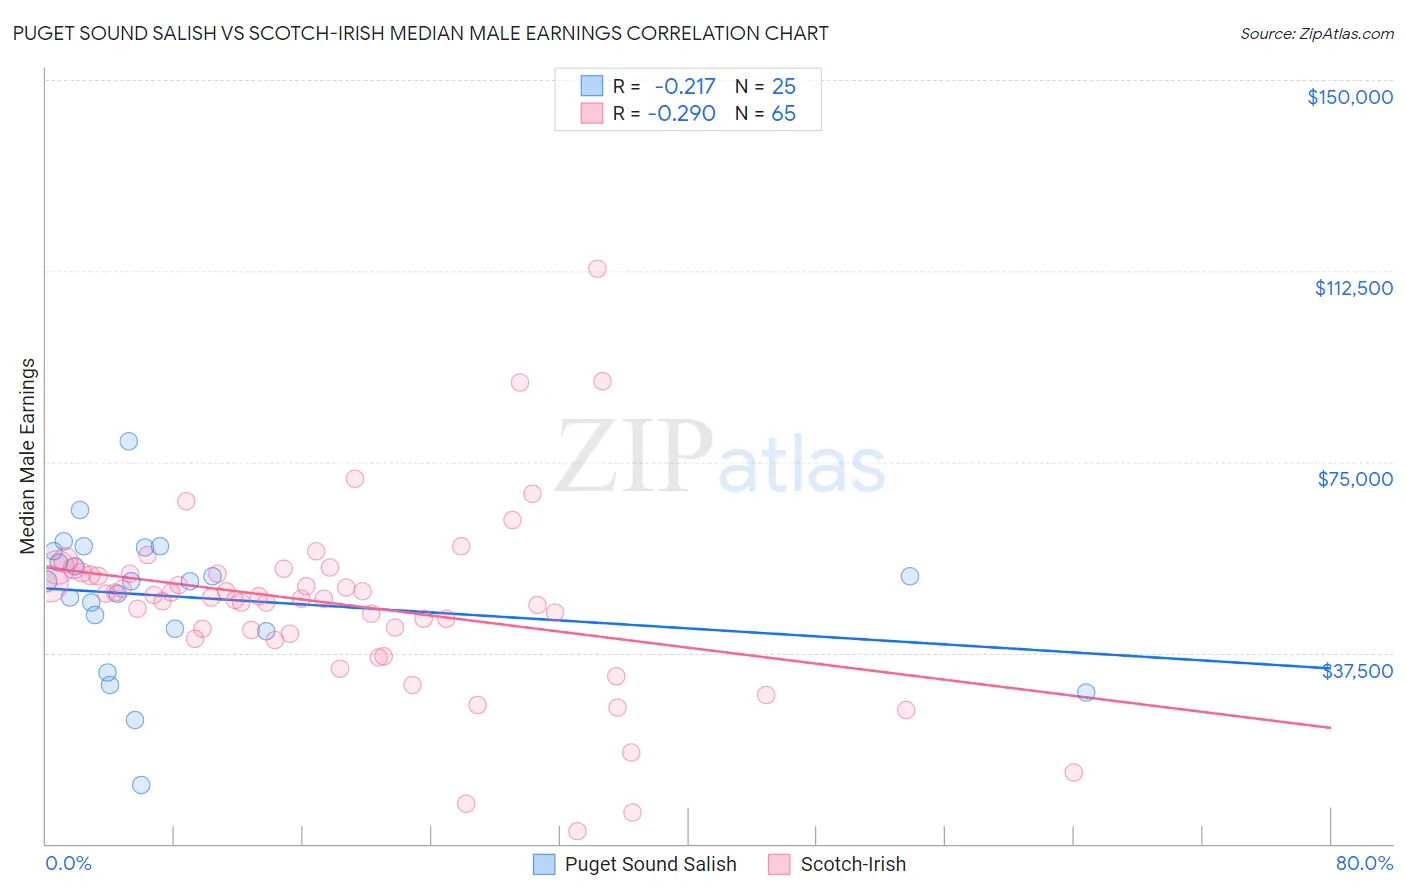
Puget Sound Salish vs Scotch-Irish Median Male Earnings Correlation Chart
The statistical analysis conducted on geographies consisting of 46,150,456 people shows a weak negative correlation between the proportion of Puget Sound Salish and median male earnings in the United States with a correlation coefficient (R) of -0.217 and weighted average of $53,704. Similarly, the statistical analysis conducted on geographies consisting of 547,724,250 people shows a weak negative correlation between the proportion of Scotch-Irish and median male earnings in the United States with a correlation coefficient (R) of -0.290 and weighted average of $53,658, a difference of 0.090%.
Median Male Earnings Correlation Summary
| Measurement | Puget Sound Salish | Scotch-Irish |
| Minimum | $11,507 | $2,499 |
| Maximum | $79,042 | $113,000 |
| Range | $67,535 | $110,501 |
| Mean | $48,401 | $47,040 |
| Median | $51,583 | $48,432 |
| Interquartile 25% (IQ1) | $42,007 | $40,813 |
| Interquartile 75% (IQ3) | $57,855 | $53,223 |
| Interquartile Range (IQR) | $15,848 | $12,411 |
| Standard Deviation (Sample) | $14,112 | $17,914 |
| Standard Deviation (Population) | $13,827 | $17,776 |
Demographics Similar to Puget Sound Salish and Scotch-Irish by Median Male Earnings
In terms of median male earnings, the demographic groups most similar to Puget Sound Salish are Immigrants from Eritrea ($53,715, a difference of 0.020%), Immigrants from Eastern Africa ($53,713, a difference of 0.020%), Uruguayan ($53,680, a difference of 0.040%), Guamanian/Chamorro ($53,661, a difference of 0.080%), and Kenyan ($53,647, a difference of 0.11%). Similarly, the demographic groups most similar to Scotch-Irish are Guamanian/Chamorro ($53,661, a difference of 0.010%), Kenyan ($53,647, a difference of 0.020%), Uruguayan ($53,680, a difference of 0.040%), Immigrants from Eastern Africa ($53,713, a difference of 0.10%), and Immigrants from Eritrea ($53,715, a difference of 0.11%).
| Demographics | Rating | Rank | Median Male Earnings |
| Iraqis | 42.5 /100 | #180 | Average $54,182 |
| Immigrants | Immigrants | 42.1 /100 | #181 | Average $54,168 |
| Yugoslavians | 37.4 /100 | #182 | Fair $53,967 |
| Immigrants | South America | 37.3 /100 | #183 | Fair $53,962 |
| Whites/Caucasians | 36.5 /100 | #184 | Fair $53,925 |
| Immigrants | Sierra Leone | 36.0 /100 | #185 | Fair $53,905 |
| Colombians | 34.4 /100 | #186 | Fair $53,832 |
| Immigrants | Eritrea | 31.8 /100 | #187 | Fair $53,715 |
| Immigrants | Eastern Africa | 31.8 /100 | #188 | Fair $53,713 |
| Puget Sound Salish | 31.6 /100 | #189 | Fair $53,704 |
| Uruguayans | 31.1 /100 | #190 | Fair $53,680 |
| Guamanians/Chamorros | 30.7 /100 | #191 | Fair $53,661 |
| Scotch-Irish | 30.6 /100 | #192 | Fair $53,658 |
| Kenyans | 30.4 /100 | #193 | Fair $53,647 |
| Spanish | 29.0 /100 | #194 | Fair $53,576 |
| Immigrants | Azores | 27.5 /100 | #195 | Fair $53,503 |
| Immigrants | Africa | 26.6 /100 | #196 | Fair $53,457 |
| Immigrants | Kenya | 26.0 /100 | #197 | Fair $53,427 |
| Immigrants | Costa Rica | 22.6 /100 | #198 | Fair $53,237 |
| Tongans | 22.3 /100 | #199 | Fair $53,218 |
| Immigrants | Thailand | 17.5 /100 | #200 | Poor $52,908 |