Puget Sound Salish vs Scotch-Irish Disability Age 35 to 64
COMPARE
Puget Sound Salish
Scotch-Irish
Disability Age 35 to 64
Disability Age 35 to 64 Comparison
Puget Sound Salish
Scotch-Irish
13.3%
DISABILITY AGE 35 TO 64
0.0/ 100
METRIC RATING
292nd/ 347
METRIC RANK
13.0%
DISABILITY AGE 35 TO 64
0.1/ 100
METRIC RATING
281st/ 347
METRIC RANK
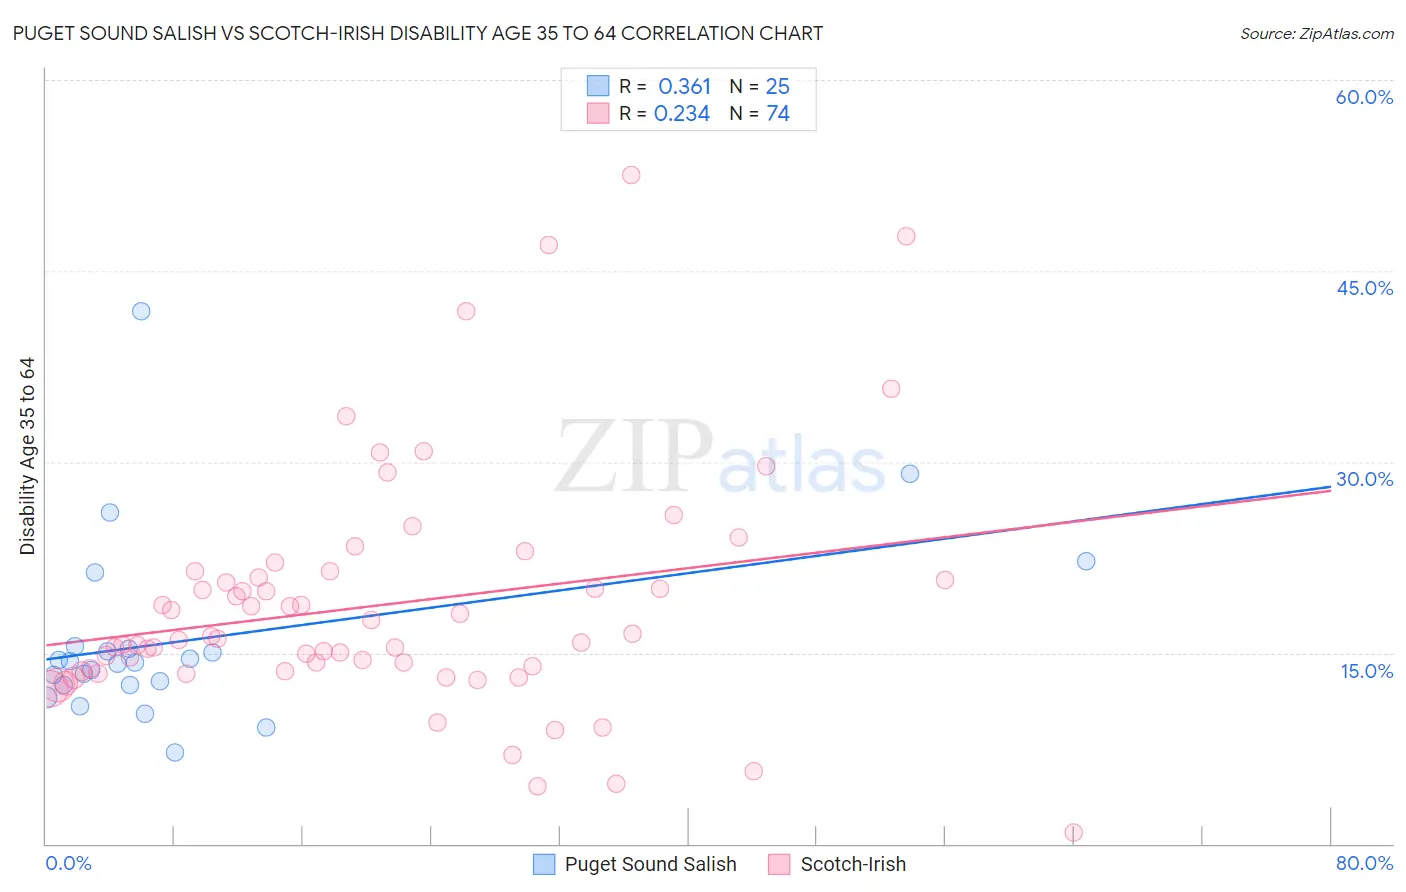
Puget Sound Salish vs Scotch-Irish Disability Age 35 to 64 Correlation Chart
The statistical analysis conducted on geographies consisting of 46,152,398 people shows a mild positive correlation between the proportion of Puget Sound Salish and percentage of population with a disability between the ages 34 and 64 in the United States with a correlation coefficient (R) of 0.361 and weighted average of 13.3%. Similarly, the statistical analysis conducted on geographies consisting of 548,060,326 people shows a weak positive correlation between the proportion of Scotch-Irish and percentage of population with a disability between the ages 34 and 64 in the United States with a correlation coefficient (R) of 0.234 and weighted average of 13.0%, a difference of 2.7%.
Disability Age 35 to 64 Correlation Summary
| Measurement | Puget Sound Salish | Scotch-Irish |
| Minimum | 7.2% | 0.87% |
| Maximum | 41.9% | 52.5% |
| Range | 34.7% | 51.7% |
| Mean | 16.0% | 18.7% |
| Median | 14.3% | 16.1% |
| Interquartile 25% (IQ1) | 12.5% | 13.6% |
| Interquartile 75% (IQ3) | 15.4% | 20.9% |
| Interquartile Range (IQR) | 2.9% | 7.3% |
| Standard Deviation (Sample) | 7.3% | 9.4% |
| Standard Deviation (Population) | 7.2% | 9.4% |
Demographics Similar to Puget Sound Salish and Scotch-Irish by Disability Age 35 to 64
In terms of disability age 35 to 64, the demographic groups most similar to Puget Sound Salish are Immigrants from Congo (13.3%, a difference of 0.050%), Ute (13.4%, a difference of 0.47%), Immigrants from Liberia (13.2%, a difference of 0.56%), Indonesian (13.2%, a difference of 0.64%), and Fijian (13.2%, a difference of 0.71%). Similarly, the demographic groups most similar to Scotch-Irish are Immigrants from Laos (13.0%, a difference of 0.090%), Liberian (12.9%, a difference of 0.20%), Immigrants from Micronesia (12.9%, a difference of 0.36%), French Canadian (12.9%, a difference of 0.39%), and Immigrants from Dominican Republic (12.9%, a difference of 0.42%).
| Demographics | Rating | Rank | Disability Age 35 to 64 |
| Somalis | 0.1 /100 | #276 | Tragic 12.9% |
| Immigrants | Dominican Republic | 0.1 /100 | #277 | Tragic 12.9% |
| French Canadians | 0.1 /100 | #278 | Tragic 12.9% |
| Immigrants | Micronesia | 0.1 /100 | #279 | Tragic 12.9% |
| Liberians | 0.1 /100 | #280 | Tragic 12.9% |
| Scotch-Irish | 0.1 /100 | #281 | Tragic 13.0% |
| Immigrants | Laos | 0.1 /100 | #282 | Tragic 13.0% |
| Central American Indians | 0.0 /100 | #283 | Tragic 13.0% |
| Immigrants | Nonimmigrants | 0.0 /100 | #284 | Tragic 13.0% |
| Immigrants | Somalia | 0.0 /100 | #285 | Tragic 13.1% |
| Hmong | 0.0 /100 | #286 | Tragic 13.1% |
| Tlingit-Haida | 0.0 /100 | #287 | Tragic 13.2% |
| Fijians | 0.0 /100 | #288 | Tragic 13.2% |
| Indonesians | 0.0 /100 | #289 | Tragic 13.2% |
| Immigrants | Liberia | 0.0 /100 | #290 | Tragic 13.2% |
| Immigrants | Congo | 0.0 /100 | #291 | Tragic 13.3% |
| Puget Sound Salish | 0.0 /100 | #292 | Tragic 13.3% |
| Ute | 0.0 /100 | #293 | Tragic 13.4% |
| Yaqui | 0.0 /100 | #294 | Tragic 13.5% |
| Yakama | 0.0 /100 | #295 | Tragic 13.6% |
| Africans | 0.0 /100 | #296 | Tragic 13.6% |