Puget Sound Salish vs Immigrants from Hong Kong Female Poverty Among 18-24 Year Olds
COMPARE
Puget Sound Salish
Immigrants from Hong Kong
Female Poverty Among 18-24 Year Olds
Female Poverty Among 18-24 Year Olds Comparison
Puget Sound Salish
Immigrants from Hong Kong
18.0%
FEMALE POVERTY AMONG 18-24 YEAR OLDS
100.0/ 100
METRIC RATING
39th/ 347
METRIC RANK
17.5%
FEMALE POVERTY AMONG 18-24 YEAR OLDS
100.0/ 100
METRIC RATING
22nd/ 347
METRIC RANK
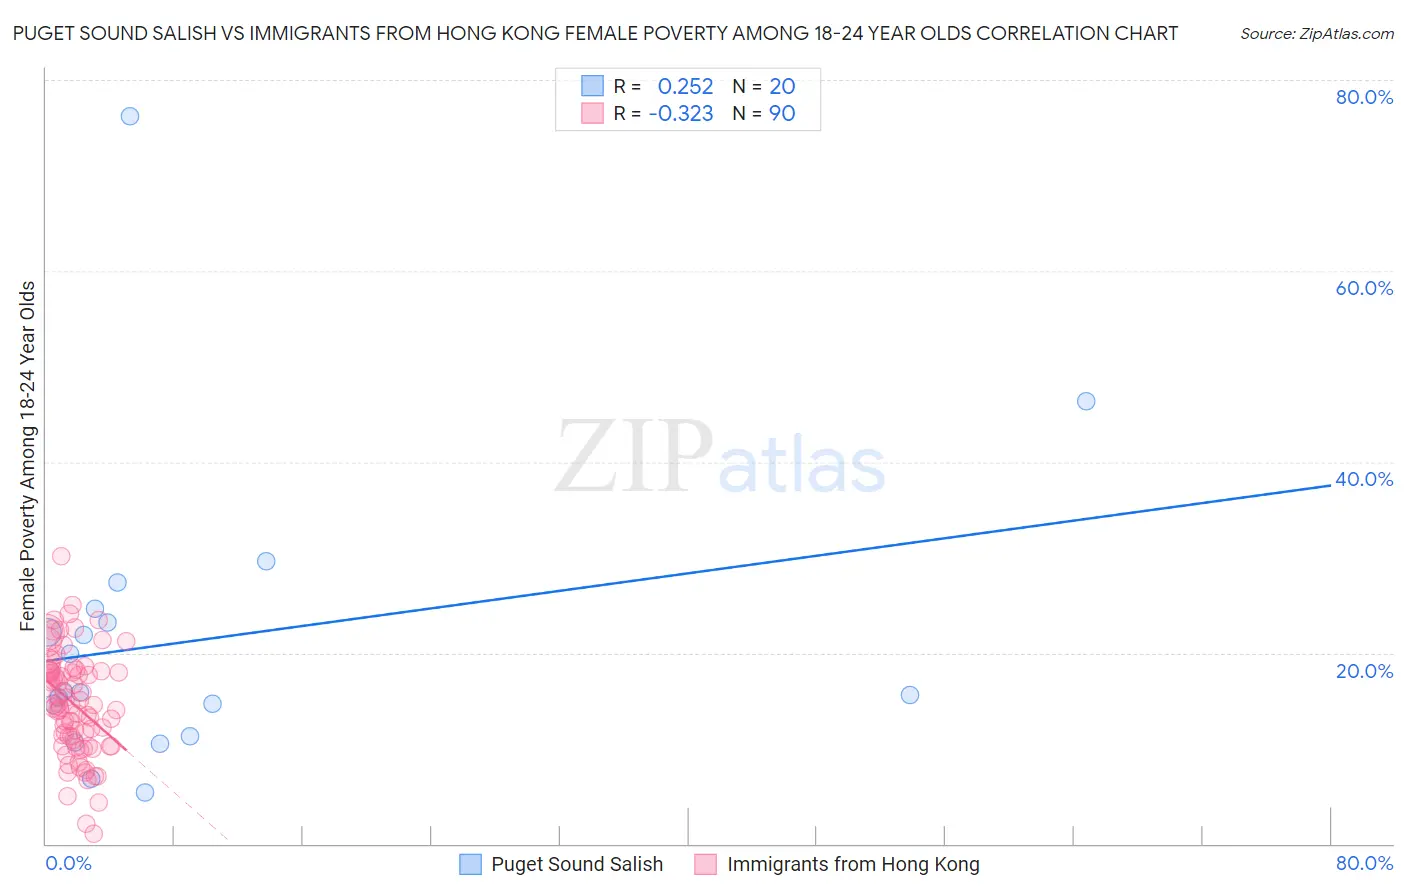
Puget Sound Salish vs Immigrants from Hong Kong Female Poverty Among 18-24 Year Olds Correlation Chart
The statistical analysis conducted on geographies consisting of 45,843,522 people shows a weak positive correlation between the proportion of Puget Sound Salish and poverty level among females between the ages 18 and 24 in the United States with a correlation coefficient (R) of 0.252 and weighted average of 18.0%. Similarly, the statistical analysis conducted on geographies consisting of 249,802,041 people shows a mild negative correlation between the proportion of Immigrants from Hong Kong and poverty level among females between the ages 18 and 24 in the United States with a correlation coefficient (R) of -0.323 and weighted average of 17.5%, a difference of 3.1%.
Female Poverty Among 18-24 Year Olds Correlation Summary
| Measurement | Puget Sound Salish | Immigrants from Hong Kong |
| Minimum | 5.3% | 1.0% |
| Maximum | 76.2% | 30.1% |
| Range | 70.9% | 29.0% |
| Mean | 21.4% | 14.6% |
| Median | 15.9% | 14.5% |
| Interquartile 25% (IQ1) | 12.9% | 10.9% |
| Interquartile 75% (IQ3) | 23.9% | 18.1% |
| Interquartile Range (IQR) | 11.0% | 7.2% |
| Standard Deviation (Sample) | 15.9% | 5.4% |
| Standard Deviation (Population) | 15.4% | 5.3% |
Demographics Similar to Puget Sound Salish and Immigrants from Hong Kong by Female Poverty Among 18-24 Year Olds
In terms of female poverty among 18-24 year olds, the demographic groups most similar to Puget Sound Salish are Immigrants from Romania (18.0%, a difference of 0.030%), South American (18.0%, a difference of 0.21%), Immigrants from Croatia (17.9%, a difference of 0.43%), Immigrants from South America (17.9%, a difference of 0.49%), and Immigrants from Greece (17.9%, a difference of 0.54%). Similarly, the demographic groups most similar to Immigrants from Hong Kong are Immigrants from Venezuela (17.4%, a difference of 0.10%), Bolivian (17.4%, a difference of 0.10%), Immigrants from North Macedonia (17.6%, a difference of 0.56%), Maltese (17.6%, a difference of 0.63%), and Immigrants from South Central Asia (17.6%, a difference of 0.81%).
| Demographics | Rating | Rank | Female Poverty Among 18-24 Year Olds |
| Immigrants | Venezuela | 100.0 /100 | #20 | Exceptional 17.4% |
| Bolivians | 100.0 /100 | #21 | Exceptional 17.4% |
| Immigrants | Hong Kong | 100.0 /100 | #22 | Exceptional 17.5% |
| Immigrants | North Macedonia | 100.0 /100 | #23 | Exceptional 17.6% |
| Maltese | 100.0 /100 | #24 | Exceptional 17.6% |
| Immigrants | South Central Asia | 100.0 /100 | #25 | Exceptional 17.6% |
| Immigrants | Fiji | 100.0 /100 | #26 | Exceptional 17.7% |
| Colombians | 100.0 /100 | #27 | Exceptional 17.7% |
| Venezuelans | 100.0 /100 | #28 | Exceptional 17.7% |
| Portuguese | 100.0 /100 | #29 | Exceptional 17.8% |
| Immigrants | South Eastern Asia | 100.0 /100 | #30 | Exceptional 17.8% |
| Immigrants | Vietnam | 100.0 /100 | #31 | Exceptional 17.8% |
| Immigrants | Moldova | 100.0 /100 | #32 | Exceptional 17.9% |
| Native Hawaiians | 100.0 /100 | #33 | Exceptional 17.9% |
| Immigrants | Nicaragua | 100.0 /100 | #34 | Exceptional 17.9% |
| Immigrants | Greece | 100.0 /100 | #35 | Exceptional 17.9% |
| Immigrants | South America | 100.0 /100 | #36 | Exceptional 17.9% |
| Immigrants | Croatia | 100.0 /100 | #37 | Exceptional 17.9% |
| South Americans | 100.0 /100 | #38 | Exceptional 18.0% |
| Puget Sound Salish | 100.0 /100 | #39 | Exceptional 18.0% |
| Immigrants | Romania | 100.0 /100 | #40 | Exceptional 18.0% |