Puget Sound Salish vs British West Indian Self-Care Disability
COMPARE
Puget Sound Salish
British West Indian
Self-Care Disability
Self-Care Disability Comparison
Puget Sound Salish
British West Indians
2.8%
SELF-CARE DISABILITY
0.0/ 100
METRIC RATING
311th/ 347
METRIC RANK
2.8%
SELF-CARE DISABILITY
0.0/ 100
METRIC RATING
310th/ 347
METRIC RANK
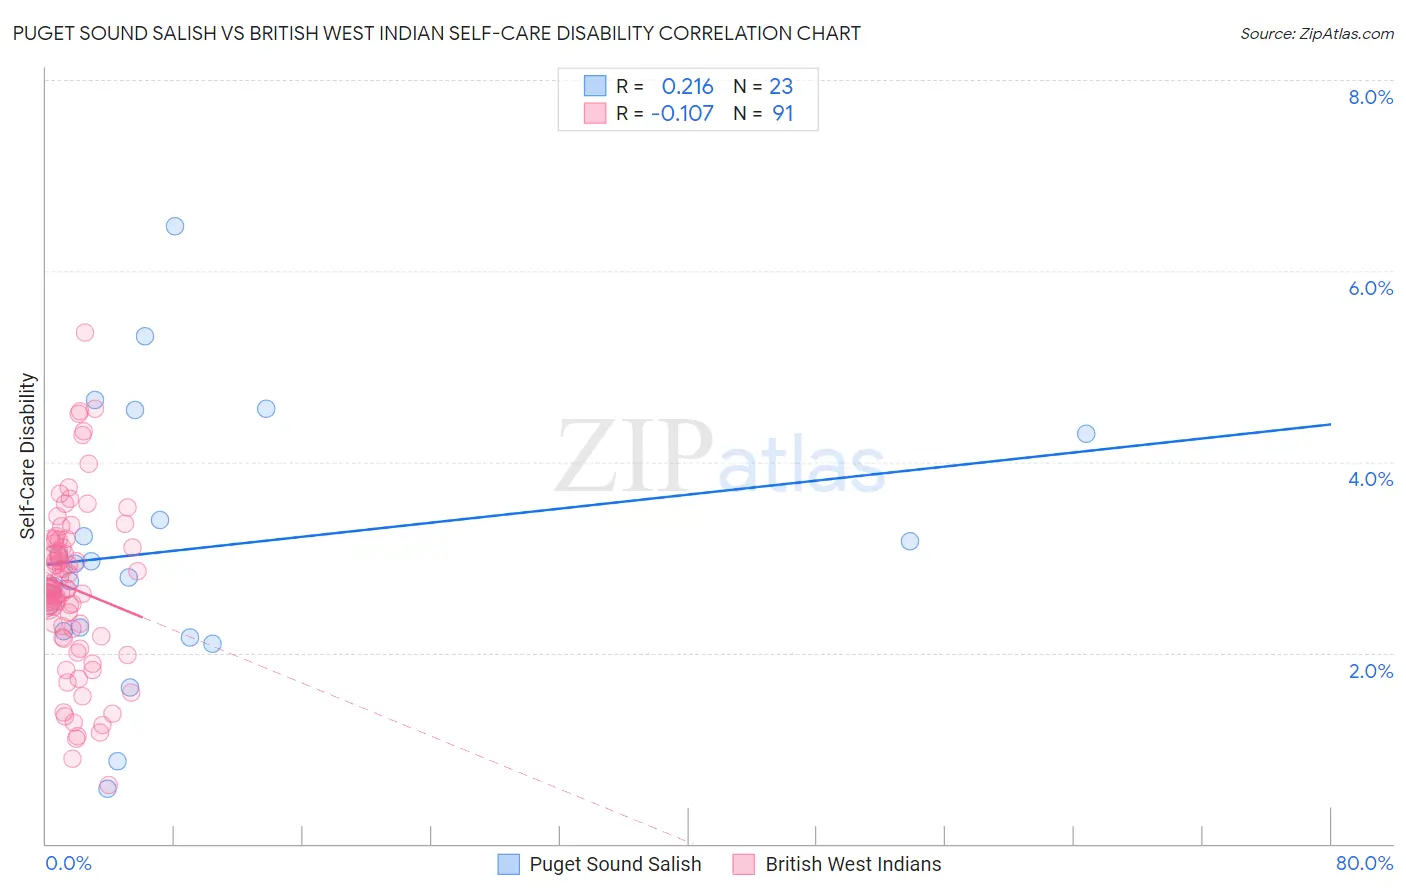
Puget Sound Salish vs British West Indian Self-Care Disability Correlation Chart
The statistical analysis conducted on geographies consisting of 46,144,161 people shows a weak positive correlation between the proportion of Puget Sound Salish and percentage of population with self-care disability in the United States with a correlation coefficient (R) of 0.216 and weighted average of 2.8%. Similarly, the statistical analysis conducted on geographies consisting of 152,617,328 people shows a poor negative correlation between the proportion of British West Indians and percentage of population with self-care disability in the United States with a correlation coefficient (R) of -0.107 and weighted average of 2.8%, a difference of 0.070%.
Self-Care Disability Correlation Summary
| Measurement | Puget Sound Salish | British West Indian |
| Minimum | 0.58% | 0.62% |
| Maximum | 6.5% | 5.4% |
| Range | 5.9% | 4.7% |
| Mean | 3.1% | 2.7% |
| Median | 2.9% | 2.7% |
| Interquartile 25% (IQ1) | 2.2% | 2.2% |
| Interquartile 75% (IQ3) | 4.3% | 3.1% |
| Interquartile Range (IQR) | 2.1% | 0.97% |
| Standard Deviation (Sample) | 1.4% | 0.87% |
| Standard Deviation (Population) | 1.4% | 0.86% |
Demographics Similar to Puget Sound Salish and British West Indians by Self-Care Disability
In terms of self-care disability, the demographic groups most similar to Puget Sound Salish are Bangladeshi (2.8%, a difference of 0.17%), Immigrants from Caribbean (2.8%, a difference of 0.19%), Spanish American (2.8%, a difference of 0.23%), Immigrants from Grenada (2.8%, a difference of 0.32%), and Creek (2.8%, a difference of 0.45%). Similarly, the demographic groups most similar to British West Indians are Bangladeshi (2.8%, a difference of 0.10%), Immigrants from Grenada (2.8%, a difference of 0.25%), Immigrants from Caribbean (2.8%, a difference of 0.26%), Spanish American (2.8%, a difference of 0.30%), and Creek (2.8%, a difference of 0.52%).
| Demographics | Rating | Rank | Self-Care Disability |
| Immigrants | Fiji | 0.0 /100 | #300 | Tragic 2.8% |
| Pima | 0.0 /100 | #301 | Tragic 2.8% |
| Immigrants | St. Vincent and the Grenadines | 0.0 /100 | #302 | Tragic 2.8% |
| Immigrants | Belize | 0.0 /100 | #303 | Tragic 2.8% |
| Cree | 0.0 /100 | #304 | Tragic 2.8% |
| Immigrants | West Indies | 0.0 /100 | #305 | Tragic 2.8% |
| Aleuts | 0.0 /100 | #306 | Tragic 2.8% |
| Natives/Alaskans | 0.0 /100 | #307 | Tragic 2.8% |
| Immigrants | Grenada | 0.0 /100 | #308 | Tragic 2.8% |
| Bangladeshis | 0.0 /100 | #309 | Tragic 2.8% |
| British West Indians | 0.0 /100 | #310 | Tragic 2.8% |
| Puget Sound Salish | 0.0 /100 | #311 | Tragic 2.8% |
| Immigrants | Caribbean | 0.0 /100 | #312 | Tragic 2.8% |
| Spanish Americans | 0.0 /100 | #313 | Tragic 2.8% |
| Creek | 0.0 /100 | #314 | Tragic 2.8% |
| Immigrants | Cuba | 0.0 /100 | #315 | Tragic 2.8% |
| Menominee | 0.0 /100 | #316 | Tragic 2.8% |
| Immigrants | Dominica | 0.0 /100 | #317 | Tragic 2.8% |
| Assyrians/Chaldeans/Syriacs | 0.0 /100 | #318 | Tragic 2.8% |
| Spanish American Indians | 0.0 /100 | #319 | Tragic 2.9% |
| Chickasaw | 0.0 /100 | #320 | Tragic 2.9% |