Potawatomi vs Immigrants from Nepal Disability Age Over 75
COMPARE
Potawatomi
Immigrants from Nepal
Disability Age Over 75
Disability Age Over 75 Comparison
Potawatomi
Immigrants from Nepal
49.0%
DISABILITY AGE OVER 75
0.2/ 100
METRIC RATING
270th/ 347
METRIC RANK
46.6%
DISABILITY AGE OVER 75
94.1/ 100
METRIC RATING
120th/ 347
METRIC RANK
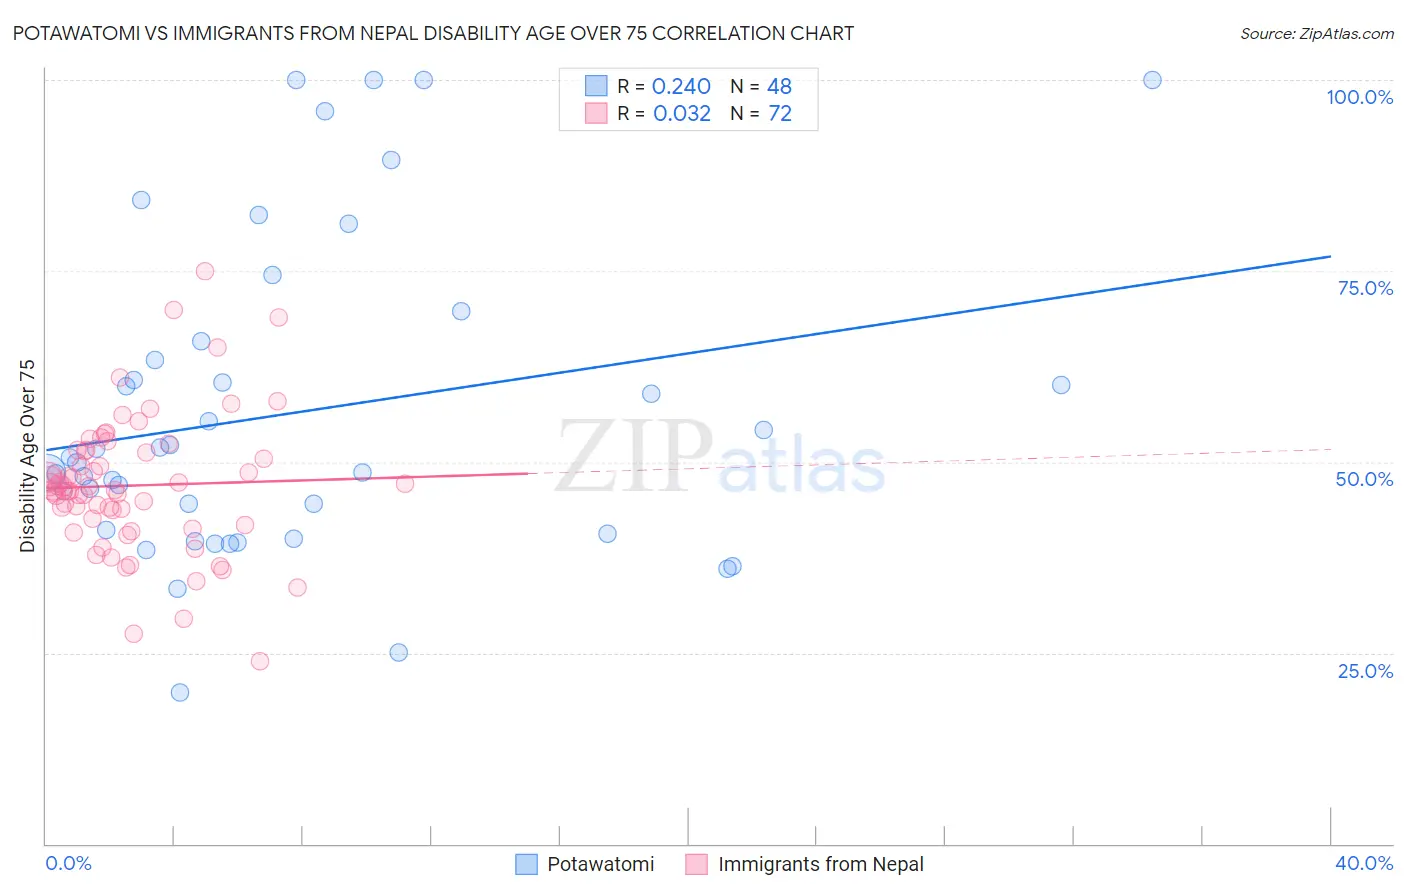
Potawatomi vs Immigrants from Nepal Disability Age Over 75 Correlation Chart
The statistical analysis conducted on geographies consisting of 117,704,790 people shows a weak positive correlation between the proportion of Potawatomi and percentage of population with a disability over the age of 75 in the United States with a correlation coefficient (R) of 0.240 and weighted average of 49.0%. Similarly, the statistical analysis conducted on geographies consisting of 186,573,944 people shows no correlation between the proportion of Immigrants from Nepal and percentage of population with a disability over the age of 75 in the United States with a correlation coefficient (R) of 0.032 and weighted average of 46.6%, a difference of 5.2%.
Disability Age Over 75 Correlation Summary
| Measurement | Potawatomi | Immigrants from Nepal |
| Minimum | 19.8% | 24.0% |
| Maximum | 100.0% | 75.0% |
| Range | 80.2% | 51.0% |
| Mean | 56.5% | 46.9% |
| Median | 50.3% | 46.5% |
| Interquartile 25% (IQ1) | 40.8% | 42.1% |
| Interquartile 75% (IQ3) | 64.6% | 51.4% |
| Interquartile Range (IQR) | 23.8% | 9.3% |
| Standard Deviation (Sample) | 20.6% | 9.0% |
| Standard Deviation (Population) | 20.4% | 8.9% |
Similar Demographics by Disability Age Over 75
Demographics Similar to Potawatomi by Disability Age Over 75
In terms of disability age over 75, the demographic groups most similar to Potawatomi are Fijian (49.0%, a difference of 0.020%), Immigrants from El Salvador (49.0%, a difference of 0.030%), Assyrian/Chaldean/Syriac (49.1%, a difference of 0.030%), Guatemalan (49.0%, a difference of 0.050%), and Malaysian (49.0%, a difference of 0.060%).
| Demographics | Rating | Rank | Disability Age Over 75 |
| Salvadorans | 0.3 /100 | #263 | Tragic 48.9% |
| Immigrants | Honduras | 0.3 /100 | #264 | Tragic 48.9% |
| Hondurans | 0.3 /100 | #265 | Tragic 48.9% |
| U.S. Virgin Islanders | 0.2 /100 | #266 | Tragic 48.9% |
| Malaysians | 0.2 /100 | #267 | Tragic 49.0% |
| Guatemalans | 0.2 /100 | #268 | Tragic 49.0% |
| Immigrants | El Salvador | 0.2 /100 | #269 | Tragic 49.0% |
| Potawatomi | 0.2 /100 | #270 | Tragic 49.0% |
| Fijians | 0.2 /100 | #271 | Tragic 49.0% |
| Assyrians/Chaldeans/Syriacs | 0.2 /100 | #272 | Tragic 49.1% |
| Immigrants | Iraq | 0.1 /100 | #273 | Tragic 49.1% |
| Immigrants | Guatemala | 0.1 /100 | #274 | Tragic 49.1% |
| Immigrants | Dominica | 0.1 /100 | #275 | Tragic 49.1% |
| Immigrants | Uzbekistan | 0.1 /100 | #276 | Tragic 49.2% |
| Hawaiians | 0.1 /100 | #277 | Tragic 49.2% |
Demographics Similar to Immigrants from Nepal by Disability Age Over 75
In terms of disability age over 75, the demographic groups most similar to Immigrants from Nepal are Canadian (46.6%, a difference of 0.030%), Scandinavian (46.6%, a difference of 0.050%), Czechoslovakian (46.6%, a difference of 0.060%), Immigrants from Albania (46.6%, a difference of 0.090%), and Hungarian (46.5%, a difference of 0.14%).
| Demographics | Rating | Rank | Disability Age Over 75 |
| Irish | 96.0 /100 | #113 | Exceptional 46.5% |
| Dutch | 95.9 /100 | #114 | Exceptional 46.5% |
| British | 95.7 /100 | #115 | Exceptional 46.5% |
| Indians (Asian) | 95.7 /100 | #116 | Exceptional 46.5% |
| Hungarians | 95.3 /100 | #117 | Exceptional 46.5% |
| Czechoslovakians | 94.7 /100 | #118 | Exceptional 46.6% |
| Canadians | 94.4 /100 | #119 | Exceptional 46.6% |
| Immigrants | Nepal | 94.1 /100 | #120 | Exceptional 46.6% |
| Scandinavians | 93.6 /100 | #121 | Exceptional 46.6% |
| Immigrants | Albania | 93.2 /100 | #122 | Exceptional 46.6% |
| Immigrants | Colombia | 92.6 /100 | #123 | Exceptional 46.7% |
| Immigrants | South America | 91.8 /100 | #124 | Exceptional 46.7% |
| Colombians | 91.3 /100 | #125 | Exceptional 46.7% |
| Europeans | 91.2 /100 | #126 | Exceptional 46.7% |
| Syrians | 91.1 /100 | #127 | Exceptional 46.7% |