Potawatomi vs West Indian Currently Married
COMPARE
Potawatomi
West Indian
Currently Married
Currently Married Comparison
Potawatomi
West Indians
46.5%
CURRENTLY MARRIED
41.9/ 100
METRIC RATING
182nd/ 347
METRIC RANK
41.3%
CURRENTLY MARRIED
0.0/ 100
METRIC RATING
314th/ 347
METRIC RANK
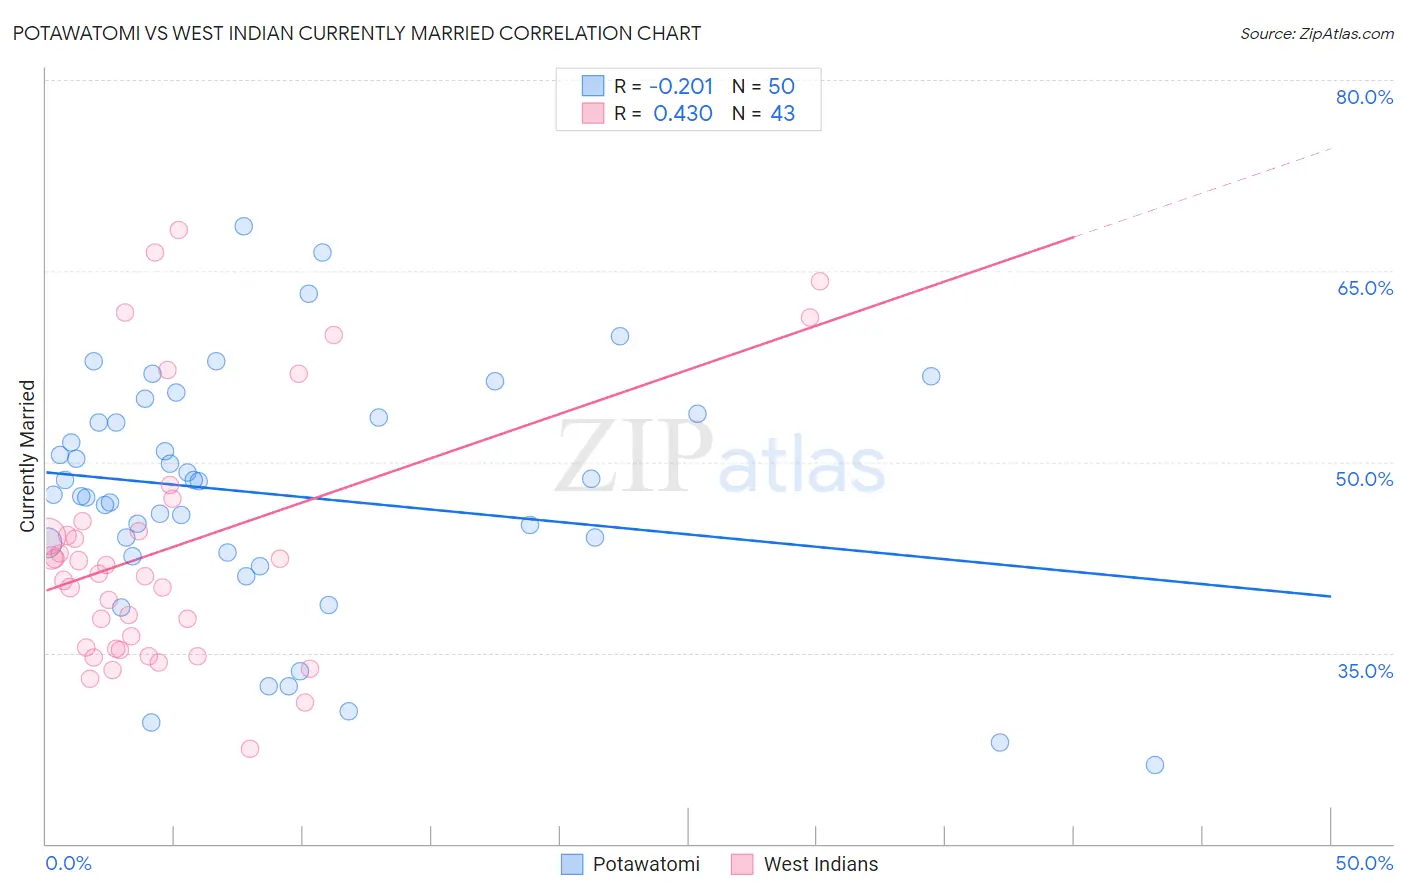
Potawatomi vs West Indian Currently Married Correlation Chart
The statistical analysis conducted on geographies consisting of 117,774,178 people shows a weak negative correlation between the proportion of Potawatomi and percentage of population currently married in the United States with a correlation coefficient (R) of -0.201 and weighted average of 46.5%. Similarly, the statistical analysis conducted on geographies consisting of 254,034,527 people shows a moderate positive correlation between the proportion of West Indians and percentage of population currently married in the United States with a correlation coefficient (R) of 0.430 and weighted average of 41.3%, a difference of 12.5%.
Currently Married Correlation Summary
| Measurement | Potawatomi | West Indian |
| Minimum | 26.2% | 27.5% |
| Maximum | 68.5% | 68.2% |
| Range | 42.3% | 40.7% |
| Mean | 47.4% | 43.3% |
| Median | 48.0% | 41.3% |
| Interquartile 25% (IQ1) | 42.9% | 35.3% |
| Interquartile 75% (IQ3) | 53.5% | 45.4% |
| Interquartile Range (IQR) | 10.6% | 10.0% |
| Standard Deviation (Sample) | 9.5% | 10.2% |
| Standard Deviation (Population) | 9.4% | 10.1% |
Similar Demographics by Currently Married
Demographics Similar to Potawatomi by Currently Married
In terms of currently married, the demographic groups most similar to Potawatomi are Ottawa (46.5%, a difference of 0.040%), Costa Rican (46.5%, a difference of 0.070%), Immigrants from Northern Africa (46.5%, a difference of 0.080%), Immigrants from Oceania (46.5%, a difference of 0.10%), and Brazilian (46.4%, a difference of 0.10%).
| Demographics | Rating | Rank | Currently Married |
| Immigrants | Brazil | 49.9 /100 | #175 | Average 46.6% |
| Hawaiians | 48.6 /100 | #176 | Average 46.6% |
| Israelis | 48.6 /100 | #177 | Average 46.6% |
| Chickasaw | 47.8 /100 | #178 | Average 46.6% |
| Immigrants | Oceania | 44.6 /100 | #179 | Average 46.5% |
| Costa Ricans | 43.7 /100 | #180 | Average 46.5% |
| Ottawa | 43.0 /100 | #181 | Average 46.5% |
| Potawatomi | 41.9 /100 | #182 | Average 46.5% |
| Immigrants | Northern Africa | 39.7 /100 | #183 | Fair 46.5% |
| Brazilians | 39.3 /100 | #184 | Fair 46.4% |
| Mongolians | 37.6 /100 | #185 | Fair 46.4% |
| Immigrants | Chile | 36.8 /100 | #186 | Fair 46.4% |
| Immigrants | Peru | 35.3 /100 | #187 | Fair 46.4% |
| Colombians | 31.8 /100 | #188 | Fair 46.3% |
| Fijians | 30.3 /100 | #189 | Fair 46.3% |
Demographics Similar to West Indians by Currently Married
In terms of currently married, the demographic groups most similar to West Indians are Jamaican (41.4%, a difference of 0.080%), Inupiat (41.3%, a difference of 0.090%), Immigrants from Caribbean (41.3%, a difference of 0.15%), Haitian (41.3%, a difference of 0.17%), and Bahamian (41.2%, a difference of 0.35%).
| Demographics | Rating | Rank | Currently Married |
| Africans | 0.0 /100 | #307 | Tragic 41.8% |
| Immigrants | Belize | 0.0 /100 | #308 | Tragic 41.8% |
| Immigrants | Liberia | 0.0 /100 | #309 | Tragic 41.8% |
| Guyanese | 0.0 /100 | #310 | Tragic 41.6% |
| Trinidadians and Tobagonians | 0.0 /100 | #311 | Tragic 41.5% |
| Somalis | 0.0 /100 | #312 | Tragic 41.5% |
| Jamaicans | 0.0 /100 | #313 | Tragic 41.4% |
| West Indians | 0.0 /100 | #314 | Tragic 41.3% |
| Inupiat | 0.0 /100 | #315 | Tragic 41.3% |
| Immigrants | Caribbean | 0.0 /100 | #316 | Tragic 41.3% |
| Haitians | 0.0 /100 | #317 | Tragic 41.3% |
| Bahamians | 0.0 /100 | #318 | Tragic 41.2% |
| Immigrants | Somalia | 0.0 /100 | #319 | Tragic 41.2% |
| Immigrants | Jamaica | 0.0 /100 | #320 | Tragic 41.1% |
| Immigrants | Congo | 0.0 /100 | #321 | Tragic 41.1% |