Potawatomi vs Cypriot Hearing Disability
COMPARE
Potawatomi
Cypriot
Hearing Disability
Hearing Disability Comparison
Potawatomi
Cypriots
4.1%
HEARING DISABILITY
0.0/ 100
METRIC RATING
326th/ 347
METRIC RANK
2.8%
HEARING DISABILITY
92.9/ 100
METRIC RATING
110th/ 347
METRIC RANK
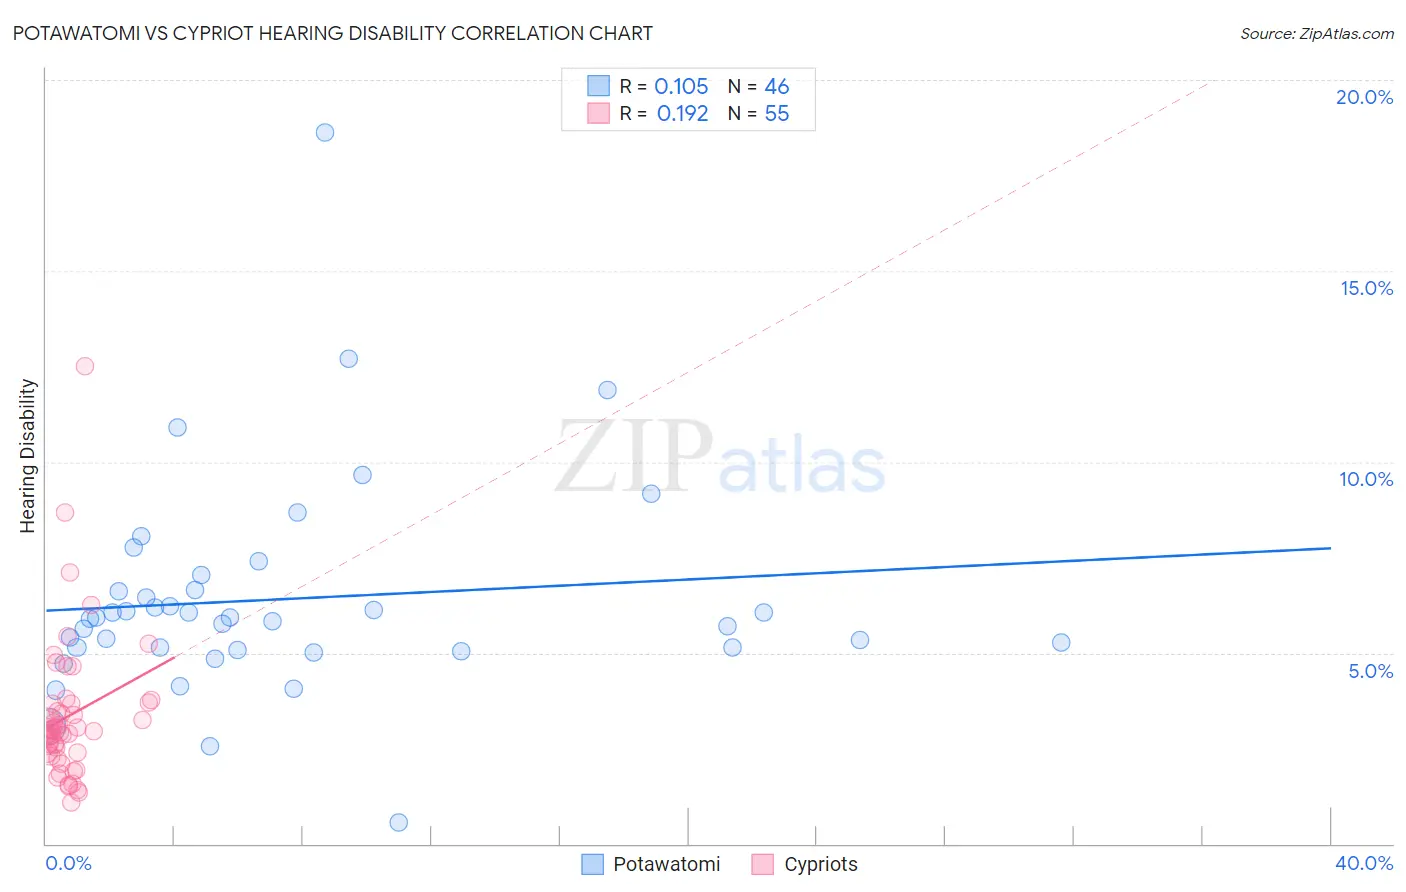
Potawatomi vs Cypriot Hearing Disability Correlation Chart
The statistical analysis conducted on geographies consisting of 117,759,395 people shows a poor positive correlation between the proportion of Potawatomi and percentage of population with hearing disability in the United States with a correlation coefficient (R) of 0.105 and weighted average of 4.1%. Similarly, the statistical analysis conducted on geographies consisting of 61,868,814 people shows a poor positive correlation between the proportion of Cypriots and percentage of population with hearing disability in the United States with a correlation coefficient (R) of 0.192 and weighted average of 2.8%, a difference of 46.4%.
Hearing Disability Correlation Summary
| Measurement | Potawatomi | Cypriot |
| Minimum | 0.55% | 1.1% |
| Maximum | 18.6% | 12.5% |
| Range | 18.1% | 11.4% |
| Mean | 6.4% | 3.3% |
| Median | 5.9% | 3.0% |
| Interquartile 25% (IQ1) | 5.1% | 2.4% |
| Interquartile 75% (IQ3) | 6.6% | 3.7% |
| Interquartile Range (IQR) | 1.5% | 1.3% |
| Standard Deviation (Sample) | 2.9% | 1.9% |
| Standard Deviation (Population) | 2.8% | 1.9% |
Similar Demographics by Hearing Disability
Demographics Similar to Potawatomi by Hearing Disability
In terms of hearing disability, the demographic groups most similar to Potawatomi are Lumbee (4.1%, a difference of 0.29%), Osage (4.1%, a difference of 0.61%), Apache (4.1%, a difference of 0.68%), Arapaho (4.1%, a difference of 0.72%), and Seminole (4.1%, a difference of 0.80%).
| Demographics | Rating | Rank | Hearing Disability |
| Chippewa | 0.0 /100 | #319 | Tragic 4.0% |
| Shoshone | 0.0 /100 | #320 | Tragic 4.0% |
| Paiute | 0.0 /100 | #321 | Tragic 4.1% |
| Seminole | 0.0 /100 | #322 | Tragic 4.1% |
| Apache | 0.0 /100 | #323 | Tragic 4.1% |
| Osage | 0.0 /100 | #324 | Tragic 4.1% |
| Lumbee | 0.0 /100 | #325 | Tragic 4.1% |
| Potawatomi | 0.0 /100 | #326 | Tragic 4.1% |
| Arapaho | 0.0 /100 | #327 | Tragic 4.1% |
| Tohono O'odham | 0.0 /100 | #328 | Tragic 4.2% |
| Crow | 0.0 /100 | #329 | Tragic 4.2% |
| Natives/Alaskans | 0.0 /100 | #330 | Tragic 4.2% |
| Cherokee | 0.0 /100 | #331 | Tragic 4.2% |
| Houma | 0.0 /100 | #332 | Tragic 4.2% |
| Dutch West Indians | 0.0 /100 | #333 | Tragic 4.3% |
Demographics Similar to Cypriots by Hearing Disability
In terms of hearing disability, the demographic groups most similar to Cypriots are Turkish (2.8%, a difference of 0.050%), Immigrants from Yemen (2.8%, a difference of 0.050%), Guatemalan (2.8%, a difference of 0.12%), U.S. Virgin Islander (2.8%, a difference of 0.12%), and Honduran (2.8%, a difference of 0.20%).
| Demographics | Rating | Rank | Hearing Disability |
| Immigrants | Indonesia | 94.7 /100 | #103 | Exceptional 2.8% |
| Burmese | 94.2 /100 | #104 | Exceptional 2.8% |
| Moroccans | 93.9 /100 | #105 | Exceptional 2.8% |
| Hondurans | 93.4 /100 | #106 | Exceptional 2.8% |
| Immigrants | Chile | 93.4 /100 | #107 | Exceptional 2.8% |
| Guatemalans | 93.2 /100 | #108 | Exceptional 2.8% |
| Turks | 93.0 /100 | #109 | Exceptional 2.8% |
| Cypriots | 92.9 /100 | #110 | Exceptional 2.8% |
| Immigrants | Yemen | 92.7 /100 | #111 | Exceptional 2.8% |
| U.S. Virgin Islanders | 92.5 /100 | #112 | Exceptional 2.8% |
| Immigrants | Belarus | 91.6 /100 | #113 | Exceptional 2.8% |
| Cambodians | 91.1 /100 | #114 | Exceptional 2.8% |
| Immigrants | Latin America | 90.5 /100 | #115 | Exceptional 2.8% |
| Immigrants | Immigrants | 90.3 /100 | #116 | Exceptional 2.8% |
| Immigrants | Liberia | 90.0 /100 | #117 | Excellent 2.8% |