Potawatomi vs Russian Cognitive Disability
COMPARE
Potawatomi
Russian
Cognitive Disability
Cognitive Disability Comparison
Potawatomi
Russians
18.0%
COGNITIVE DISABILITY
0.2/ 100
METRIC RATING
271st/ 347
METRIC RANK
16.4%
COGNITIVE DISABILITY
99.9/ 100
METRIC RATING
34th/ 347
METRIC RANK
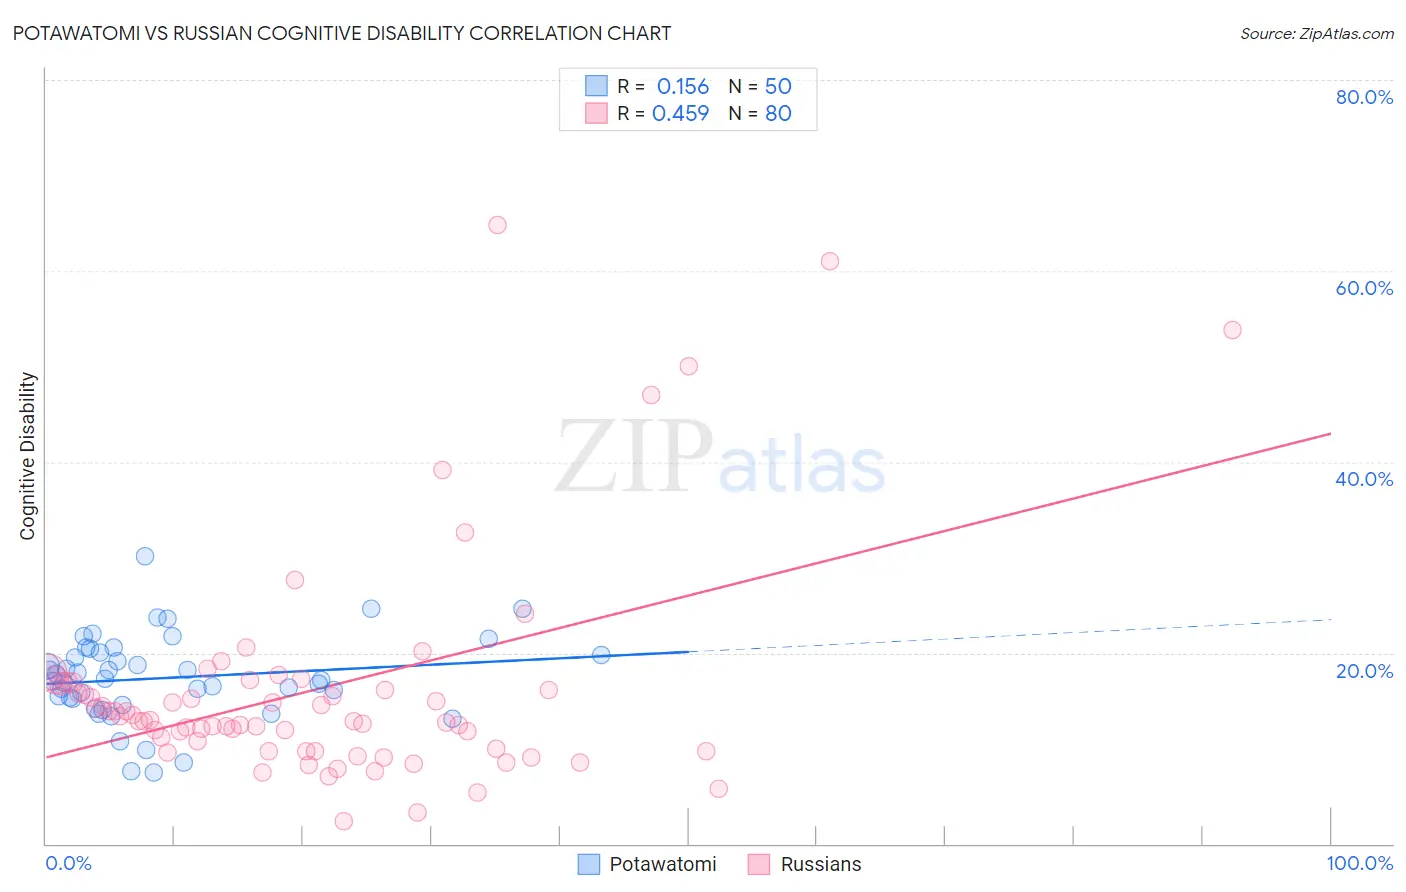
Potawatomi vs Russian Cognitive Disability Correlation Chart
The statistical analysis conducted on geographies consisting of 117,767,379 people shows a poor positive correlation between the proportion of Potawatomi and percentage of population with cognitive disability in the United States with a correlation coefficient (R) of 0.156 and weighted average of 18.0%. Similarly, the statistical analysis conducted on geographies consisting of 512,152,080 people shows a moderate positive correlation between the proportion of Russians and percentage of population with cognitive disability in the United States with a correlation coefficient (R) of 0.459 and weighted average of 16.4%, a difference of 9.8%.
Cognitive Disability Correlation Summary
| Measurement | Potawatomi | Russian |
| Minimum | 7.5% | 2.3% |
| Maximum | 30.0% | 64.9% |
| Range | 22.5% | 62.5% |
| Mean | 17.4% | 16.1% |
| Median | 17.2% | 12.9% |
| Interquartile 25% (IQ1) | 15.2% | 9.9% |
| Interquartile 75% (IQ3) | 20.0% | 16.8% |
| Interquartile Range (IQR) | 4.8% | 7.0% |
| Standard Deviation (Sample) | 4.4% | 11.7% |
| Standard Deviation (Population) | 4.4% | 11.6% |
Similar Demographics by Cognitive Disability
Demographics Similar to Potawatomi by Cognitive Disability
In terms of cognitive disability, the demographic groups most similar to Potawatomi are Immigrants from Honduras (18.0%, a difference of 0.010%), Immigrants from Bahamas (18.0%, a difference of 0.070%), Honduran (18.0%, a difference of 0.080%), Immigrants from Nepal (18.0%, a difference of 0.13%), and Immigrants from Nigeria (18.0%, a difference of 0.14%).
| Demographics | Rating | Rank | Cognitive Disability |
| Menominee | 0.4 /100 | #264 | Tragic 18.0% |
| Spanish Americans | 0.4 /100 | #265 | Tragic 18.0% |
| Belizeans | 0.4 /100 | #266 | Tragic 18.0% |
| Nepalese | 0.3 /100 | #267 | Tragic 18.0% |
| Cherokee | 0.3 /100 | #268 | Tragic 18.0% |
| Hondurans | 0.3 /100 | #269 | Tragic 18.0% |
| Immigrants | Bahamas | 0.3 /100 | #270 | Tragic 18.0% |
| Potawatomi | 0.2 /100 | #271 | Tragic 18.0% |
| Immigrants | Honduras | 0.2 /100 | #272 | Tragic 18.0% |
| Immigrants | Nepal | 0.2 /100 | #273 | Tragic 18.0% |
| Immigrants | Nigeria | 0.2 /100 | #274 | Tragic 18.0% |
| Immigrants | Laos | 0.2 /100 | #275 | Tragic 18.1% |
| Yuman | 0.2 /100 | #276 | Tragic 18.1% |
| Immigrants | Kuwait | 0.2 /100 | #277 | Tragic 18.1% |
| Immigrants | Micronesia | 0.2 /100 | #278 | Tragic 18.1% |
Demographics Similar to Russians by Cognitive Disability
In terms of cognitive disability, the demographic groups most similar to Russians are Italian (16.4%, a difference of 0.0%), Immigrants from Israel (16.4%, a difference of 0.080%), Slovak (16.4%, a difference of 0.080%), Greek (16.4%, a difference of 0.090%), and Immigrants from Romania (16.4%, a difference of 0.13%).
| Demographics | Rating | Rank | Cognitive Disability |
| Immigrants | Pakistan | 99.9 /100 | #27 | Exceptional 16.4% |
| Poles | 99.9 /100 | #28 | Exceptional 16.4% |
| Filipinos | 99.9 /100 | #29 | Exceptional 16.4% |
| Czechs | 99.9 /100 | #30 | Exceptional 16.4% |
| Immigrants | Romania | 99.9 /100 | #31 | Exceptional 16.4% |
| Immigrants | Israel | 99.9 /100 | #32 | Exceptional 16.4% |
| Italians | 99.9 /100 | #33 | Exceptional 16.4% |
| Russians | 99.9 /100 | #34 | Exceptional 16.4% |
| Slovaks | 99.9 /100 | #35 | Exceptional 16.4% |
| Greeks | 99.9 /100 | #36 | Exceptional 16.4% |
| Slovenes | 99.9 /100 | #37 | Exceptional 16.5% |
| Immigrants | Eastern Europe | 99.9 /100 | #38 | Exceptional 16.5% |
| Bolivians | 99.9 /100 | #39 | Exceptional 16.5% |
| Immigrants | Belarus | 99.9 /100 | #40 | Exceptional 16.5% |
| Cubans | 99.9 /100 | #41 | Exceptional 16.5% |