Potawatomi vs Immigrants from Haiti Cognitive Disability
COMPARE
Potawatomi
Immigrants from Haiti
Cognitive Disability
Cognitive Disability Comparison
Potawatomi
Immigrants from Haiti
18.0%
COGNITIVE DISABILITY
0.2/ 100
METRIC RATING
271st/ 347
METRIC RANK
17.4%
COGNITIVE DISABILITY
27.1/ 100
METRIC RATING
192nd/ 347
METRIC RANK
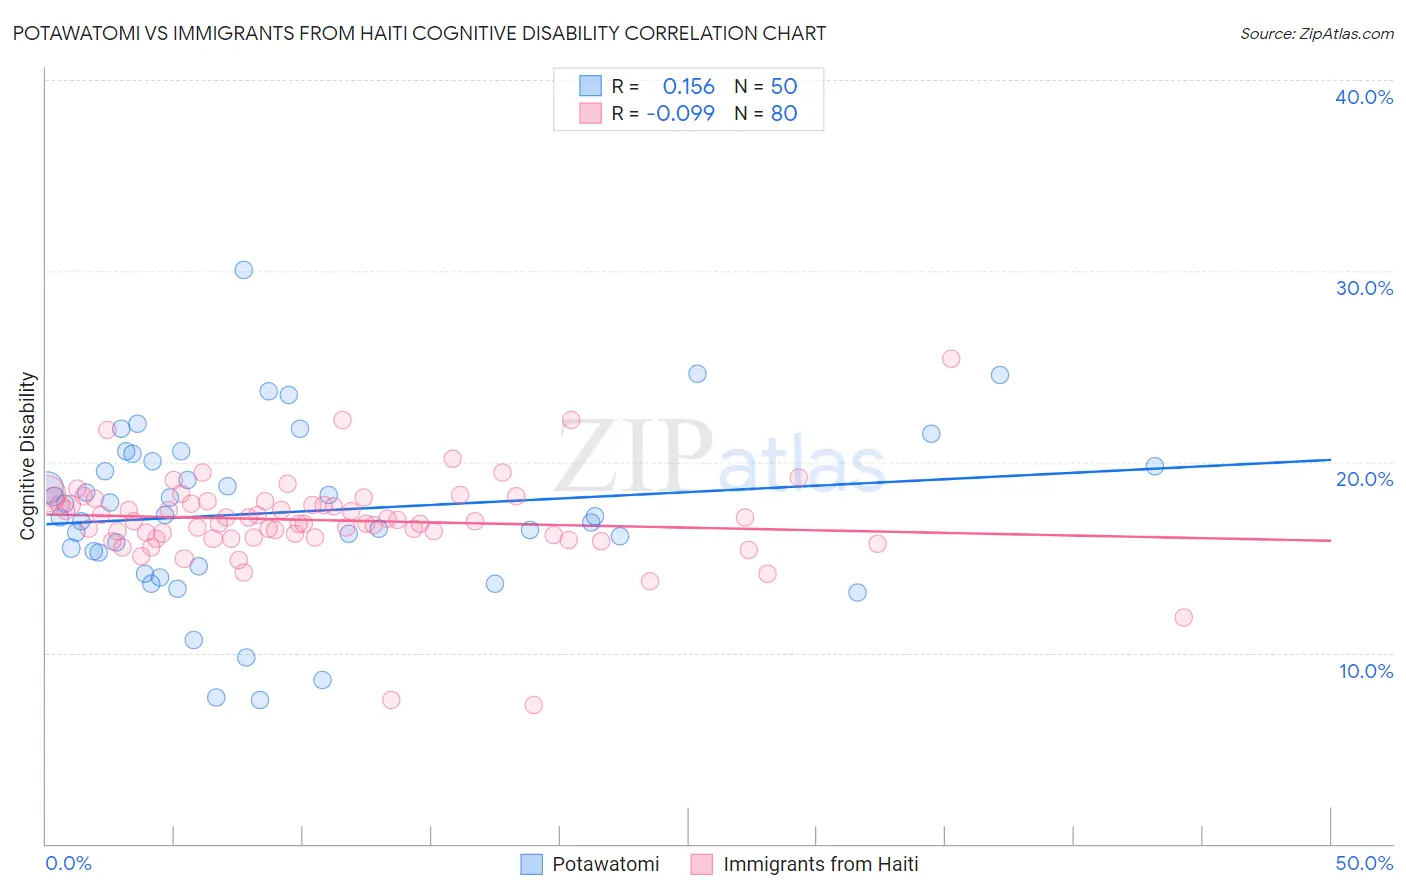
Potawatomi vs Immigrants from Haiti Cognitive Disability Correlation Chart
The statistical analysis conducted on geographies consisting of 117,767,379 people shows a poor positive correlation between the proportion of Potawatomi and percentage of population with cognitive disability in the United States with a correlation coefficient (R) of 0.156 and weighted average of 18.0%. Similarly, the statistical analysis conducted on geographies consisting of 225,240,715 people shows a slight negative correlation between the proportion of Immigrants from Haiti and percentage of population with cognitive disability in the United States with a correlation coefficient (R) of -0.099 and weighted average of 17.4%, a difference of 3.6%.
Cognitive Disability Correlation Summary
| Measurement | Potawatomi | Immigrants from Haiti |
| Minimum | 7.5% | 7.3% |
| Maximum | 30.0% | 25.4% |
| Range | 22.5% | 18.2% |
| Mean | 17.4% | 16.9% |
| Median | 17.2% | 16.9% |
| Interquartile 25% (IQ1) | 15.2% | 16.0% |
| Interquartile 75% (IQ3) | 20.0% | 17.9% |
| Interquartile Range (IQR) | 4.8% | 1.9% |
| Standard Deviation (Sample) | 4.4% | 2.4% |
| Standard Deviation (Population) | 4.4% | 2.4% |
Similar Demographics by Cognitive Disability
Demographics Similar to Potawatomi by Cognitive Disability
In terms of cognitive disability, the demographic groups most similar to Potawatomi are Immigrants from Honduras (18.0%, a difference of 0.010%), Immigrants from Bahamas (18.0%, a difference of 0.070%), Honduran (18.0%, a difference of 0.080%), Immigrants from Nepal (18.0%, a difference of 0.13%), and Immigrants from Nigeria (18.0%, a difference of 0.14%).
| Demographics | Rating | Rank | Cognitive Disability |
| Menominee | 0.4 /100 | #264 | Tragic 18.0% |
| Spanish Americans | 0.4 /100 | #265 | Tragic 18.0% |
| Belizeans | 0.4 /100 | #266 | Tragic 18.0% |
| Nepalese | 0.3 /100 | #267 | Tragic 18.0% |
| Cherokee | 0.3 /100 | #268 | Tragic 18.0% |
| Hondurans | 0.3 /100 | #269 | Tragic 18.0% |
| Immigrants | Bahamas | 0.3 /100 | #270 | Tragic 18.0% |
| Potawatomi | 0.2 /100 | #271 | Tragic 18.0% |
| Immigrants | Honduras | 0.2 /100 | #272 | Tragic 18.0% |
| Immigrants | Nepal | 0.2 /100 | #273 | Tragic 18.0% |
| Immigrants | Nigeria | 0.2 /100 | #274 | Tragic 18.0% |
| Immigrants | Laos | 0.2 /100 | #275 | Tragic 18.1% |
| Yuman | 0.2 /100 | #276 | Tragic 18.1% |
| Immigrants | Kuwait | 0.2 /100 | #277 | Tragic 18.1% |
| Immigrants | Micronesia | 0.2 /100 | #278 | Tragic 18.1% |
Demographics Similar to Immigrants from Haiti by Cognitive Disability
In terms of cognitive disability, the demographic groups most similar to Immigrants from Haiti are Nonimmigrants (17.4%, a difference of 0.010%), Immigrants from Spain (17.4%, a difference of 0.020%), Delaware (17.4%, a difference of 0.050%), Immigrants from Western Asia (17.4%, a difference of 0.080%), and Immigrants from France (17.4%, a difference of 0.090%).
| Demographics | Rating | Rank | Cognitive Disability |
| Afghans | 38.2 /100 | #185 | Fair 17.3% |
| Cambodians | 35.9 /100 | #186 | Fair 17.3% |
| Immigrants | Fiji | 33.7 /100 | #187 | Fair 17.4% |
| Immigrants | France | 29.8 /100 | #188 | Fair 17.4% |
| Immigrants | Western Asia | 29.5 /100 | #189 | Fair 17.4% |
| Immigrants | Spain | 27.7 /100 | #190 | Fair 17.4% |
| Immigrants | Nonimmigrants | 27.4 /100 | #191 | Fair 17.4% |
| Immigrants | Haiti | 27.1 /100 | #192 | Fair 17.4% |
| Delaware | 25.6 /100 | #193 | Fair 17.4% |
| Immigrants | Bosnia and Herzegovina | 22.0 /100 | #194 | Fair 17.4% |
| New Zealanders | 21.1 /100 | #195 | Fair 17.4% |
| Guyanese | 17.5 /100 | #196 | Poor 17.5% |
| Immigrants | Afghanistan | 16.7 /100 | #197 | Poor 17.5% |
| Immigrants | Panama | 14.8 /100 | #198 | Poor 17.5% |
| Immigrants | Singapore | 14.3 /100 | #199 | Poor 17.5% |