Yaqui vs Puget Sound Salish Disability Age Over 75
COMPARE
Yaqui
Puget Sound Salish
Disability Age Over 75
Disability Age Over 75 Comparison
Yaqui
Puget Sound Salish
49.8%
DISABILITY AGE OVER 75
0.0/ 100
METRIC RATING
288th/ 347
METRIC RANK
49.8%
DISABILITY AGE OVER 75
0.0/ 100
METRIC RATING
290th/ 347
METRIC RANK
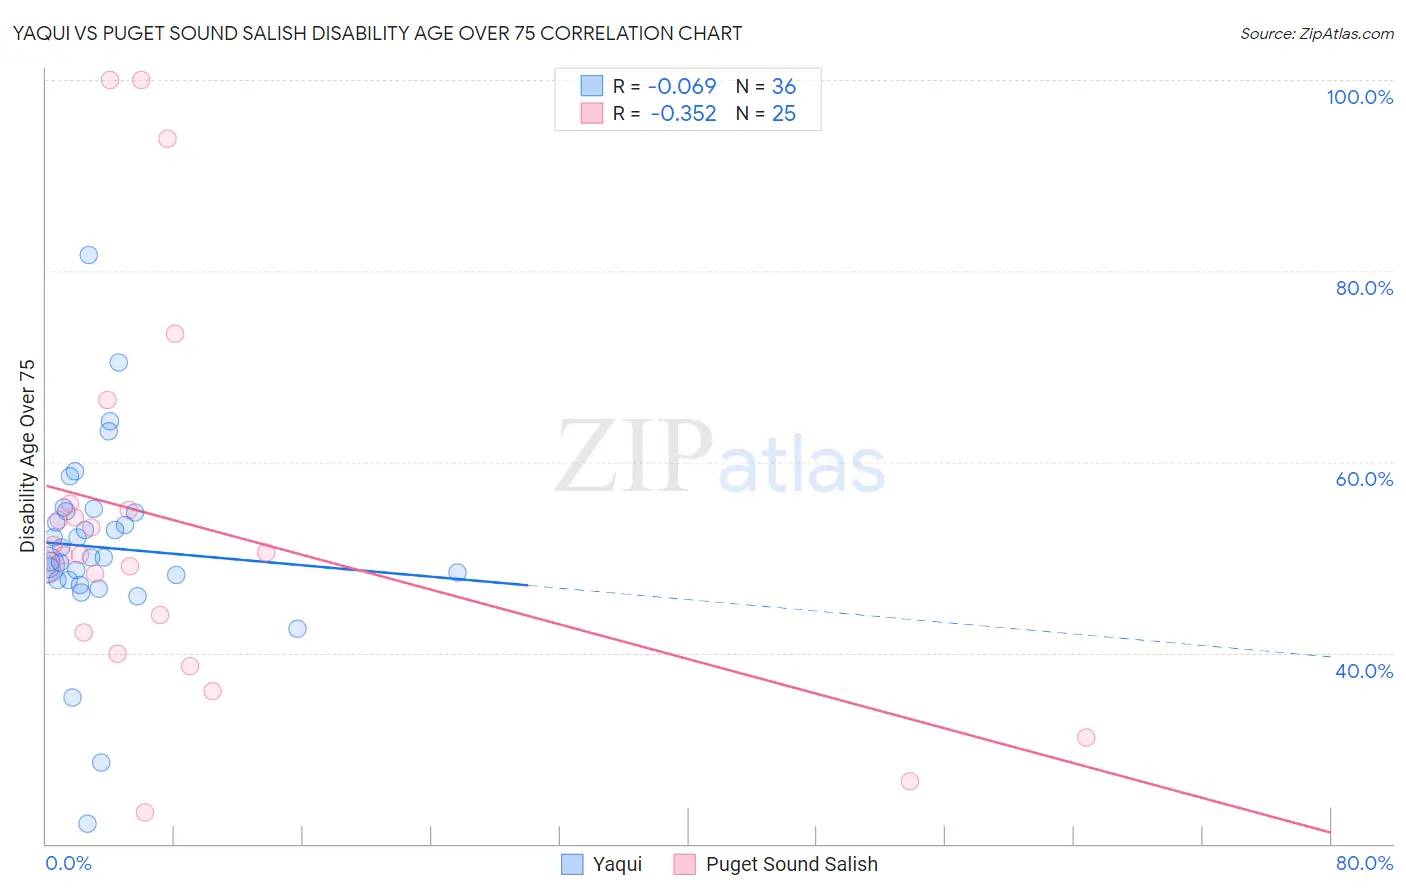
Yaqui vs Puget Sound Salish Disability Age Over 75 Correlation Chart
The statistical analysis conducted on geographies consisting of 107,650,566 people shows a slight negative correlation between the proportion of Yaqui and percentage of population with a disability over the age of 75 in the United States with a correlation coefficient (R) of -0.069 and weighted average of 49.8%. Similarly, the statistical analysis conducted on geographies consisting of 46,127,650 people shows a mild negative correlation between the proportion of Puget Sound Salish and percentage of population with a disability over the age of 75 in the United States with a correlation coefficient (R) of -0.352 and weighted average of 49.8%, a difference of 0.090%.
Disability Age Over 75 Correlation Summary
| Measurement | Yaqui | Puget Sound Salish |
| Minimum | 22.1% | 23.3% |
| Maximum | 81.7% | 100.0% |
| Range | 59.5% | 76.7% |
| Mean | 51.0% | 53.4% |
| Median | 50.0% | 50.3% |
| Interquartile 25% (IQ1) | 47.6% | 41.0% |
| Interquartile 75% (IQ3) | 54.8% | 55.3% |
| Interquartile Range (IQR) | 7.1% | 14.3% |
| Standard Deviation (Sample) | 10.2% | 20.1% |
| Standard Deviation (Population) | 10.1% | 19.7% |
Demographics Similar to Yaqui and Puget Sound Salish by Disability Age Over 75
In terms of disability age over 75, the demographic groups most similar to Yaqui are Sioux (49.7%, a difference of 0.050%), Osage (49.8%, a difference of 0.080%), Arapaho (49.8%, a difference of 0.090%), Shoshone (49.9%, a difference of 0.16%), and Immigrants from Belize (49.6%, a difference of 0.26%). Similarly, the demographic groups most similar to Puget Sound Salish are Arapaho (49.8%, a difference of 0.0%), Osage (49.8%, a difference of 0.010%), Shoshone (49.9%, a difference of 0.070%), Sioux (49.7%, a difference of 0.14%), and Spanish American Indian (49.9%, a difference of 0.23%).
| Demographics | Rating | Rank | Disability Age Over 75 |
| Guamanians/Chamorros | 0.0 /100 | #279 | Tragic 49.4% |
| Bangladeshis | 0.0 /100 | #280 | Tragic 49.4% |
| Belizeans | 0.0 /100 | #281 | Tragic 49.4% |
| Blacks/African Americans | 0.0 /100 | #282 | Tragic 49.5% |
| Samoans | 0.0 /100 | #283 | Tragic 49.5% |
| Immigrants | Latin America | 0.0 /100 | #284 | Tragic 49.5% |
| Crow | 0.0 /100 | #285 | Tragic 49.6% |
| Immigrants | Belize | 0.0 /100 | #286 | Tragic 49.6% |
| Sioux | 0.0 /100 | #287 | Tragic 49.7% |
| Yaqui | 0.0 /100 | #288 | Tragic 49.8% |
| Osage | 0.0 /100 | #289 | Tragic 49.8% |
| Puget Sound Salish | 0.0 /100 | #290 | Tragic 49.8% |
| Arapaho | 0.0 /100 | #291 | Tragic 49.8% |
| Shoshone | 0.0 /100 | #292 | Tragic 49.9% |
| Spanish American Indians | 0.0 /100 | #293 | Tragic 49.9% |
| Immigrants | Cambodia | 0.0 /100 | #294 | Tragic 50.0% |
| Spanish Americans | 0.0 /100 | #295 | Tragic 50.0% |
| Mexican American Indians | 0.0 /100 | #296 | Tragic 50.0% |
| Armenians | 0.0 /100 | #297 | Tragic 50.0% |
| Marshallese | 0.0 /100 | #298 | Tragic 50.1% |
| Immigrants | Micronesia | 0.0 /100 | #299 | Tragic 50.1% |