Immigrants from Iran vs German Russian Ambulatory Disability
COMPARE
Immigrants from Iran
German Russian
Ambulatory Disability
Ambulatory Disability Comparison
Immigrants from Iran
German Russians
5.4%
AMBULATORY DISABILITY
100.0/ 100
METRIC RATING
29th/ 347
METRIC RANK
6.3%
AMBULATORY DISABILITY
9.4/ 100
METRIC RATING
222nd/ 347
METRIC RANK
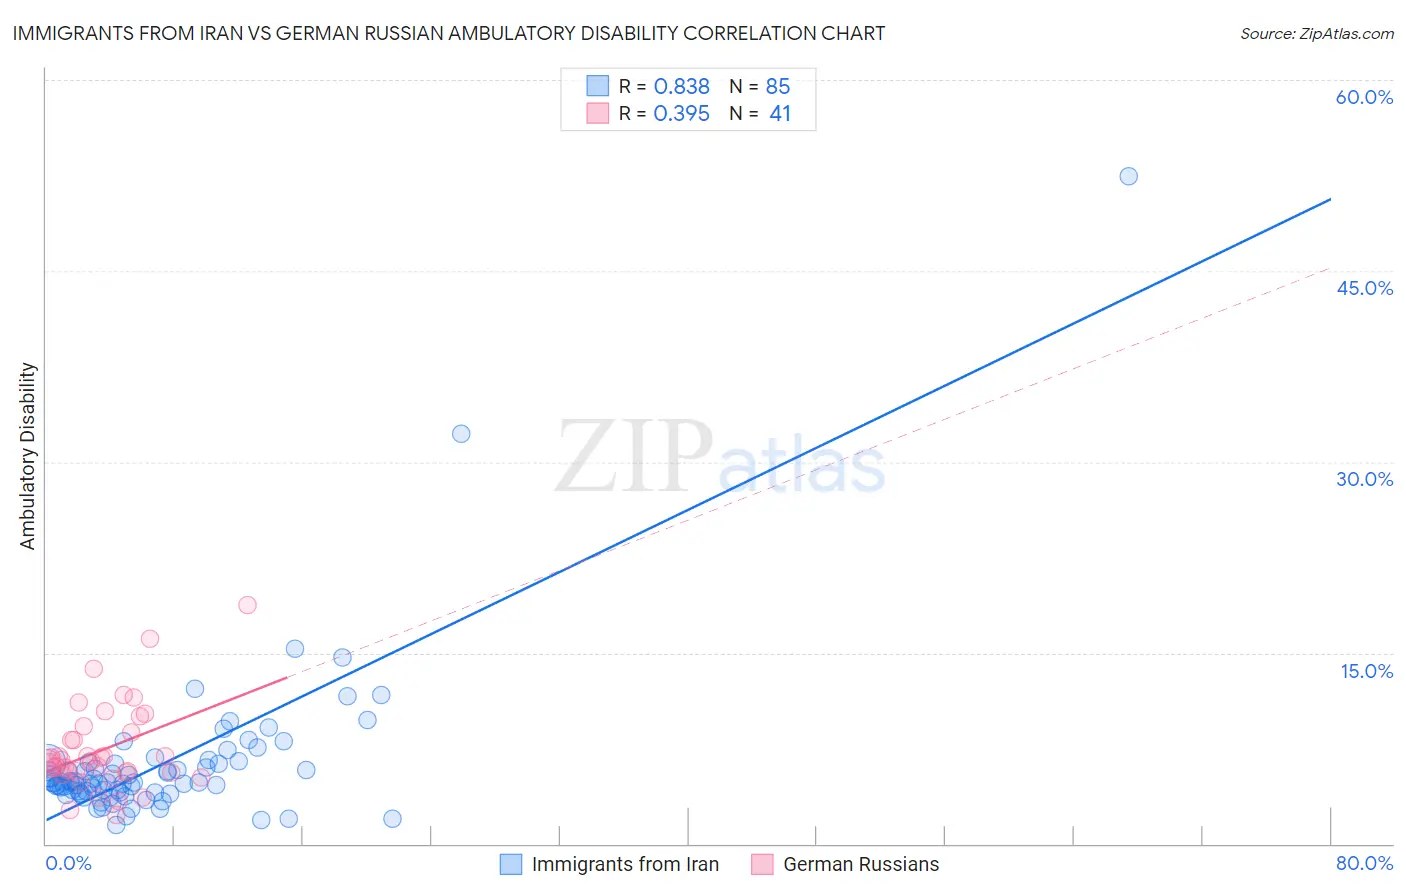
Immigrants from Iran vs German Russian Ambulatory Disability Correlation Chart
The statistical analysis conducted on geographies consisting of 279,879,747 people shows a very strong positive correlation between the proportion of Immigrants from Iran and percentage of population with ambulatory disability in the United States with a correlation coefficient (R) of 0.838 and weighted average of 5.4%. Similarly, the statistical analysis conducted on geographies consisting of 96,455,793 people shows a mild positive correlation between the proportion of German Russians and percentage of population with ambulatory disability in the United States with a correlation coefficient (R) of 0.395 and weighted average of 6.3%, a difference of 16.4%.
Ambulatory Disability Correlation Summary
| Measurement | Immigrants from Iran | German Russian |
| Minimum | 1.5% | 2.3% |
| Maximum | 52.5% | 18.8% |
| Range | 51.0% | 16.5% |
| Mean | 6.3% | 7.4% |
| Median | 4.8% | 6.5% |
| Interquartile 25% (IQ1) | 4.0% | 5.6% |
| Interquartile 75% (IQ3) | 6.3% | 9.0% |
| Interquartile Range (IQR) | 2.3% | 3.4% |
| Standard Deviation (Sample) | 6.4% | 3.4% |
| Standard Deviation (Population) | 6.3% | 3.4% |
Similar Demographics by Ambulatory Disability
Demographics Similar to Immigrants from Iran by Ambulatory Disability
In terms of ambulatory disability, the demographic groups most similar to Immigrants from Iran are Cambodian (5.4%, a difference of 0.10%), Asian (5.4%, a difference of 0.16%), Immigrants from Nepal (5.4%, a difference of 0.32%), Zimbabwean (5.4%, a difference of 0.35%), and Immigrants from Saudi Arabia (5.4%, a difference of 0.43%).
| Demographics | Rating | Rank | Ambulatory Disability |
| Immigrants | Israel | 100.0 /100 | #22 | Exceptional 5.4% |
| Tongans | 100.0 /100 | #23 | Exceptional 5.4% |
| Immigrants | Saudi Arabia | 100.0 /100 | #24 | Exceptional 5.4% |
| Zimbabweans | 100.0 /100 | #25 | Exceptional 5.4% |
| Immigrants | Nepal | 100.0 /100 | #26 | Exceptional 5.4% |
| Asians | 100.0 /100 | #27 | Exceptional 5.4% |
| Cambodians | 100.0 /100 | #28 | Exceptional 5.4% |
| Immigrants | Iran | 100.0 /100 | #29 | Exceptional 5.4% |
| Immigrants | Turkey | 100.0 /100 | #30 | Exceptional 5.4% |
| Immigrants | Venezuela | 100.0 /100 | #31 | Exceptional 5.4% |
| Immigrants | Australia | 100.0 /100 | #32 | Exceptional 5.5% |
| Immigrants | Pakistan | 100.0 /100 | #33 | Exceptional 5.5% |
| Immigrants | Asia | 100.0 /100 | #34 | Exceptional 5.5% |
| Afghans | 100.0 /100 | #35 | Exceptional 5.5% |
| Immigrants | Malaysia | 100.0 /100 | #36 | Exceptional 5.5% |
Demographics Similar to German Russians by Ambulatory Disability
In terms of ambulatory disability, the demographic groups most similar to German Russians are Immigrants from Albania (6.3%, a difference of 0.030%), Hungarian (6.3%, a difference of 0.030%), Indonesian (6.3%, a difference of 0.070%), Guamanian/Chamorro (6.3%, a difference of 0.17%), and Canadian (6.3%, a difference of 0.21%).
| Demographics | Rating | Rank | Ambulatory Disability |
| Immigrants | Latin America | 11.0 /100 | #215 | Poor 6.3% |
| Canadians | 10.9 /100 | #216 | Poor 6.3% |
| Yugoslavians | 10.9 /100 | #217 | Poor 6.3% |
| Guamanians/Chamorros | 10.6 /100 | #218 | Poor 6.3% |
| Indonesians | 9.9 /100 | #219 | Tragic 6.3% |
| Immigrants | Albania | 9.6 /100 | #220 | Tragic 6.3% |
| Hungarians | 9.6 /100 | #221 | Tragic 6.3% |
| German Russians | 9.4 /100 | #222 | Tragic 6.3% |
| Immigrants | Honduras | 7.6 /100 | #223 | Tragic 6.3% |
| Liberians | 7.1 /100 | #224 | Tragic 6.3% |
| Hondurans | 6.3 /100 | #225 | Tragic 6.3% |
| Slavs | 5.1 /100 | #226 | Tragic 6.4% |
| Cubans | 4.0 /100 | #227 | Tragic 6.4% |
| Portuguese | 4.0 /100 | #228 | Tragic 6.4% |
| Czechoslovakians | 3.8 /100 | #229 | Tragic 6.4% |