Portuguese vs Macedonian Disability Age Over 75
COMPARE
Portuguese
Macedonian
Disability Age Over 75
Disability Age Over 75 Comparison
Portuguese
Macedonians
47.6%
DISABILITY AGE OVER 75
29.3/ 100
METRIC RATING
191st/ 347
METRIC RANK
45.4%
DISABILITY AGE OVER 75
99.9/ 100
METRIC RATING
26th/ 347
METRIC RANK
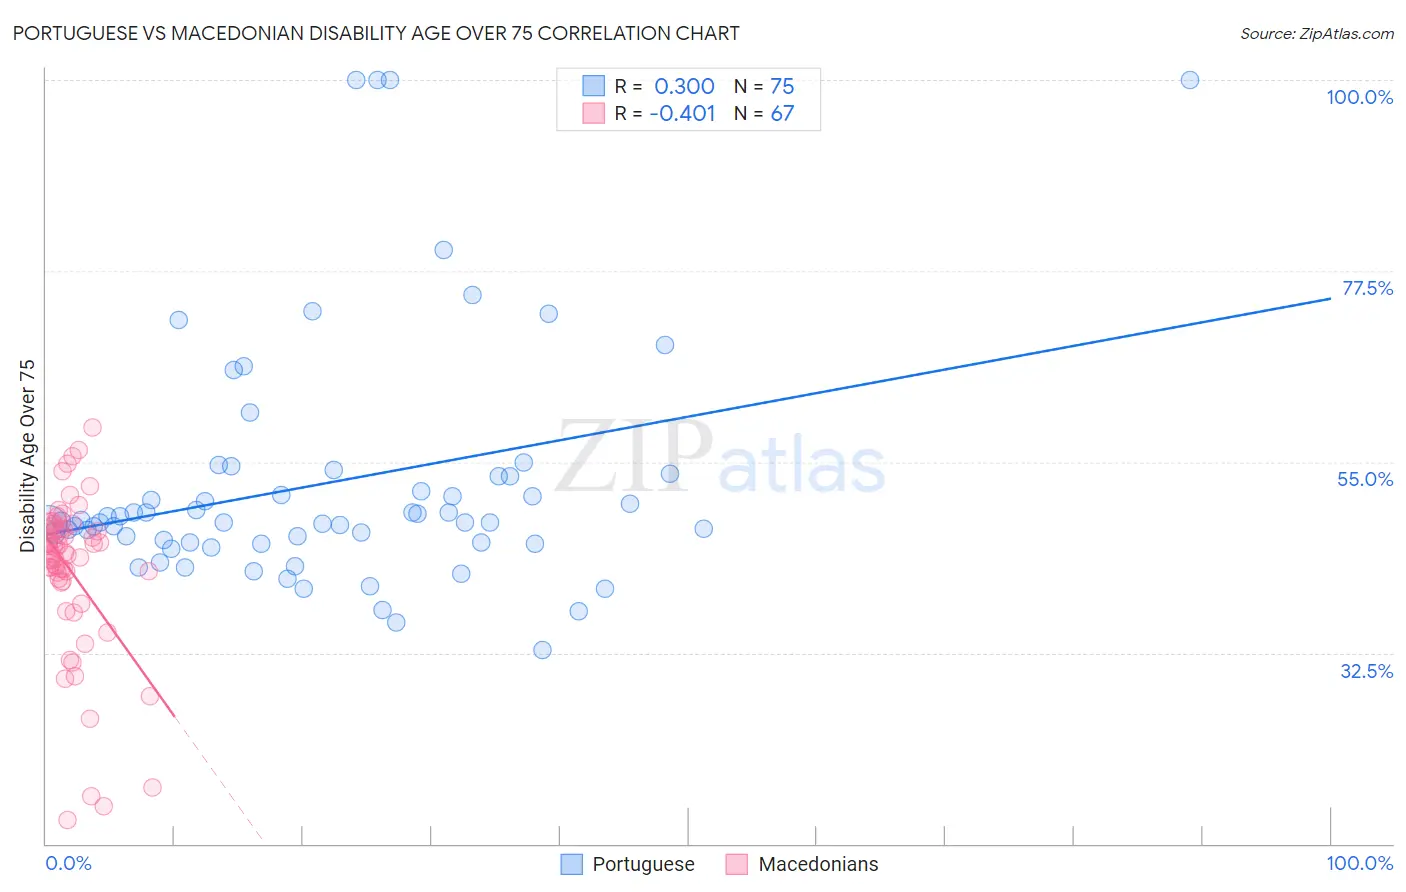
Portuguese vs Macedonian Disability Age Over 75 Correlation Chart
The statistical analysis conducted on geographies consisting of 449,198,171 people shows a mild positive correlation between the proportion of Portuguese and percentage of population with a disability over the age of 75 in the United States with a correlation coefficient (R) of 0.300 and weighted average of 47.6%. Similarly, the statistical analysis conducted on geographies consisting of 132,585,926 people shows a moderate negative correlation between the proportion of Macedonians and percentage of population with a disability over the age of 75 in the United States with a correlation coefficient (R) of -0.401 and weighted average of 45.4%, a difference of 4.8%.
Disability Age Over 75 Correlation Summary
| Measurement | Portuguese | Macedonian |
| Minimum | 32.8% | 12.8% |
| Maximum | 100.0% | 59.0% |
| Range | 67.2% | 46.2% |
| Mean | 52.5% | 42.2% |
| Median | 47.9% | 44.3% |
| Interquartile 25% (IQ1) | 45.5% | 40.9% |
| Interquartile 75% (IQ3) | 53.3% | 47.1% |
| Interquartile Range (IQR) | 7.8% | 6.2% |
| Standard Deviation (Sample) | 14.5% | 9.5% |
| Standard Deviation (Population) | 14.4% | 9.5% |
Similar Demographics by Disability Age Over 75
Demographics Similar to Portuguese by Disability Age Over 75
In terms of disability age over 75, the demographic groups most similar to Portuguese are Somali (47.6%, a difference of 0.010%), Immigrants from Jamaica (47.6%, a difference of 0.030%), Ottawa (47.6%, a difference of 0.030%), Basque (47.6%, a difference of 0.040%), and Immigrants from Kenya (47.6%, a difference of 0.040%).
| Demographics | Rating | Rank | Disability Age Over 75 |
| Immigrants | Nigeria | 34.0 /100 | #184 | Fair 47.5% |
| Ghanaians | 33.0 /100 | #185 | Fair 47.5% |
| Sudanese | 32.0 /100 | #186 | Fair 47.5% |
| Immigrants | Sudan | 31.8 /100 | #187 | Fair 47.5% |
| Basques | 30.9 /100 | #188 | Fair 47.6% |
| Immigrants | Kenya | 30.8 /100 | #189 | Fair 47.6% |
| Somalis | 29.5 /100 | #190 | Fair 47.6% |
| Portuguese | 29.3 /100 | #191 | Fair 47.6% |
| Immigrants | Jamaica | 28.3 /100 | #192 | Fair 47.6% |
| Ottawa | 28.1 /100 | #193 | Fair 47.6% |
| Immigrants | Lebanon | 26.5 /100 | #194 | Fair 47.6% |
| Immigrants | Trinidad and Tobago | 25.3 /100 | #195 | Fair 47.6% |
| Immigrants | Portugal | 23.8 /100 | #196 | Fair 47.6% |
| Pakistanis | 23.4 /100 | #197 | Fair 47.7% |
| Immigrants | Ukraine | 23.2 /100 | #198 | Fair 47.7% |
Demographics Similar to Macedonians by Disability Age Over 75
In terms of disability age over 75, the demographic groups most similar to Macedonians are Immigrants from Poland (45.4%, a difference of 0.010%), Immigrants from Bolivia (45.4%, a difference of 0.040%), Thai (45.4%, a difference of 0.040%), Polish (45.3%, a difference of 0.080%), and Filipino (45.4%, a difference of 0.080%).
| Demographics | Rating | Rank | Disability Age Over 75 |
| Immigrants | Greece | 100.0 /100 | #19 | Exceptional 45.2% |
| Immigrants | Serbia | 100.0 /100 | #20 | Exceptional 45.3% |
| Immigrants | Belgium | 100.0 /100 | #21 | Exceptional 45.3% |
| Immigrants | South Africa | 100.0 /100 | #22 | Exceptional 45.3% |
| Immigrants | Switzerland | 99.9 /100 | #23 | Exceptional 45.3% |
| Poles | 99.9 /100 | #24 | Exceptional 45.3% |
| Immigrants | Bolivia | 99.9 /100 | #25 | Exceptional 45.4% |
| Macedonians | 99.9 /100 | #26 | Exceptional 45.4% |
| Immigrants | Poland | 99.9 /100 | #27 | Exceptional 45.4% |
| Thais | 99.9 /100 | #28 | Exceptional 45.4% |
| Filipinos | 99.9 /100 | #29 | Exceptional 45.4% |
| Immigrants | Denmark | 99.9 /100 | #30 | Exceptional 45.4% |
| Immigrants | Bulgaria | 99.9 /100 | #31 | Exceptional 45.5% |
| Immigrants | Australia | 99.9 /100 | #32 | Exceptional 45.5% |
| Immigrants | Croatia | 99.9 /100 | #33 | Exceptional 45.5% |