Portuguese vs Tsimshian Cognitive Disability
COMPARE
Portuguese
Tsimshian
Cognitive Disability
Cognitive Disability Comparison
Portuguese
Tsimshian
16.9%
COGNITIVE DISABILITY
94.7/ 100
METRIC RATING
123rd/ 347
METRIC RANK
17.3%
COGNITIVE DISABILITY
49.8/ 100
METRIC RATING
175th/ 347
METRIC RANK
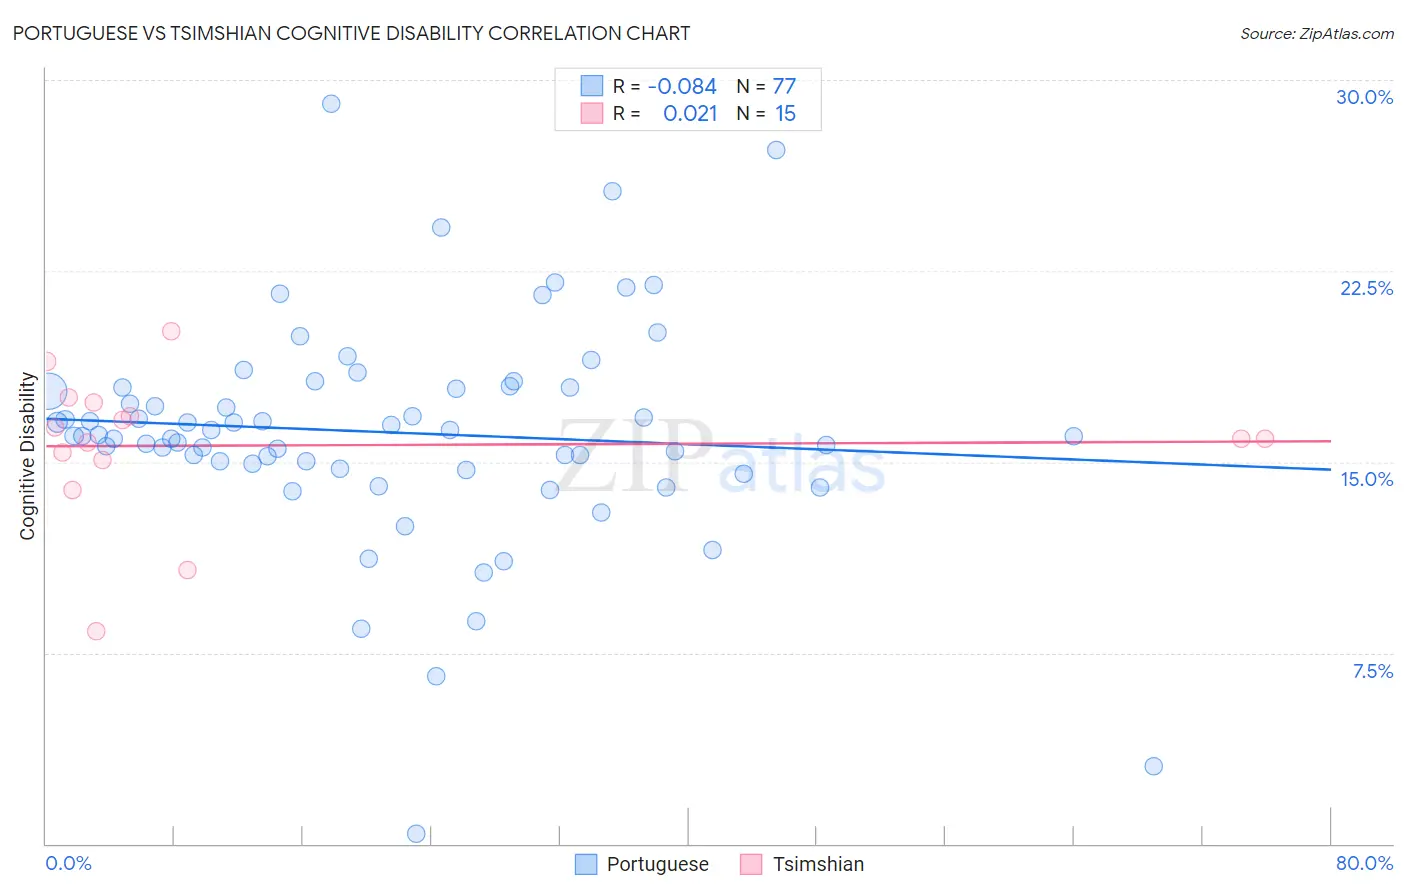
Portuguese vs Tsimshian Cognitive Disability Correlation Chart
The statistical analysis conducted on geographies consisting of 450,269,576 people shows a slight negative correlation between the proportion of Portuguese and percentage of population with cognitive disability in the United States with a correlation coefficient (R) of -0.084 and weighted average of 16.9%. Similarly, the statistical analysis conducted on geographies consisting of 15,626,544 people shows no correlation between the proportion of Tsimshian and percentage of population with cognitive disability in the United States with a correlation coefficient (R) of 0.021 and weighted average of 17.3%, a difference of 2.1%.
Cognitive Disability Correlation Summary
| Measurement | Portuguese | Tsimshian |
| Minimum | 0.38% | 8.4% |
| Maximum | 29.1% | 20.1% |
| Range | 28.7% | 11.8% |
| Mean | 16.2% | 15.6% |
| Median | 16.0% | 15.9% |
| Interquartile 25% (IQ1) | 14.8% | 15.1% |
| Interquartile 75% (IQ3) | 17.9% | 17.3% |
| Interquartile Range (IQR) | 3.1% | 2.3% |
| Standard Deviation (Sample) | 4.4% | 2.9% |
| Standard Deviation (Population) | 4.4% | 2.8% |
Similar Demographics by Cognitive Disability
Demographics Similar to Portuguese by Cognitive Disability
In terms of cognitive disability, the demographic groups most similar to Portuguese are Immigrants from Western Europe (16.9%, a difference of 0.010%), Turkish (16.9%, a difference of 0.020%), Immigrants from China (16.9%, a difference of 0.030%), Scottish (16.9%, a difference of 0.040%), and Scandinavian (16.9%, a difference of 0.080%).
| Demographics | Rating | Rank | Cognitive Disability |
| Inupiat | 96.5 /100 | #116 | Exceptional 16.9% |
| Immigrants | Japan | 96.2 /100 | #117 | Exceptional 16.9% |
| Immigrants | Denmark | 96.2 /100 | #118 | Exceptional 16.9% |
| South Africans | 95.5 /100 | #119 | Exceptional 16.9% |
| Scottish | 95.0 /100 | #120 | Exceptional 16.9% |
| Immigrants | China | 94.9 /100 | #121 | Exceptional 16.9% |
| Immigrants | Western Europe | 94.8 /100 | #122 | Exceptional 16.9% |
| Portuguese | 94.7 /100 | #123 | Exceptional 16.9% |
| Turks | 94.5 /100 | #124 | Exceptional 16.9% |
| Scandinavians | 94.1 /100 | #125 | Exceptional 16.9% |
| Europeans | 93.4 /100 | #126 | Exceptional 17.0% |
| Immigrants | Costa Rica | 93.1 /100 | #127 | Exceptional 17.0% |
| Nicaraguans | 93.0 /100 | #128 | Exceptional 17.0% |
| Immigrants | Uruguay | 92.9 /100 | #129 | Exceptional 17.0% |
| Immigrants | Vietnam | 92.4 /100 | #130 | Exceptional 17.0% |
Demographics Similar to Tsimshian by Cognitive Disability
In terms of cognitive disability, the demographic groups most similar to Tsimshian are Immigrants from Northern Africa (17.3%, a difference of 0.010%), Laotian (17.3%, a difference of 0.010%), Shoshone (17.3%, a difference of 0.020%), Ute (17.3%, a difference of 0.020%), and Spanish (17.3%, a difference of 0.020%).
| Demographics | Rating | Rank | Cognitive Disability |
| Immigrants | Immigrants | 62.5 /100 | #168 | Good 17.2% |
| Immigrants | Portugal | 61.8 /100 | #169 | Good 17.2% |
| Ecuadorians | 59.6 /100 | #170 | Average 17.2% |
| Tlingit-Haida | 59.4 /100 | #171 | Average 17.2% |
| Immigrants | Turkey | 56.7 /100 | #172 | Average 17.2% |
| Immigrants | Northern Africa | 50.2 /100 | #173 | Average 17.3% |
| Laotians | 50.0 /100 | #174 | Average 17.3% |
| Tsimshian | 49.8 /100 | #175 | Average 17.3% |
| Shoshone | 49.2 /100 | #176 | Average 17.3% |
| Ute | 49.1 /100 | #177 | Average 17.3% |
| Spanish | 48.9 /100 | #178 | Average 17.3% |
| Sioux | 48.6 /100 | #179 | Average 17.3% |
| Pakistanis | 43.9 /100 | #180 | Average 17.3% |
| Immigrants | Guyana | 42.9 /100 | #181 | Average 17.3% |
| Arabs | 42.8 /100 | #182 | Average 17.3% |