Native Hawaiian vs Immigrants from Indonesia Ambulatory Disability
COMPARE
Native Hawaiian
Immigrants from Indonesia
Ambulatory Disability
Ambulatory Disability Comparison
Native Hawaiians
Immigrants from Indonesia
6.5%
AMBULATORY DISABILITY
1.1/ 100
METRIC RATING
249th/ 347
METRIC RANK
5.5%
AMBULATORY DISABILITY
99.9/ 100
METRIC RATING
44th/ 347
METRIC RANK
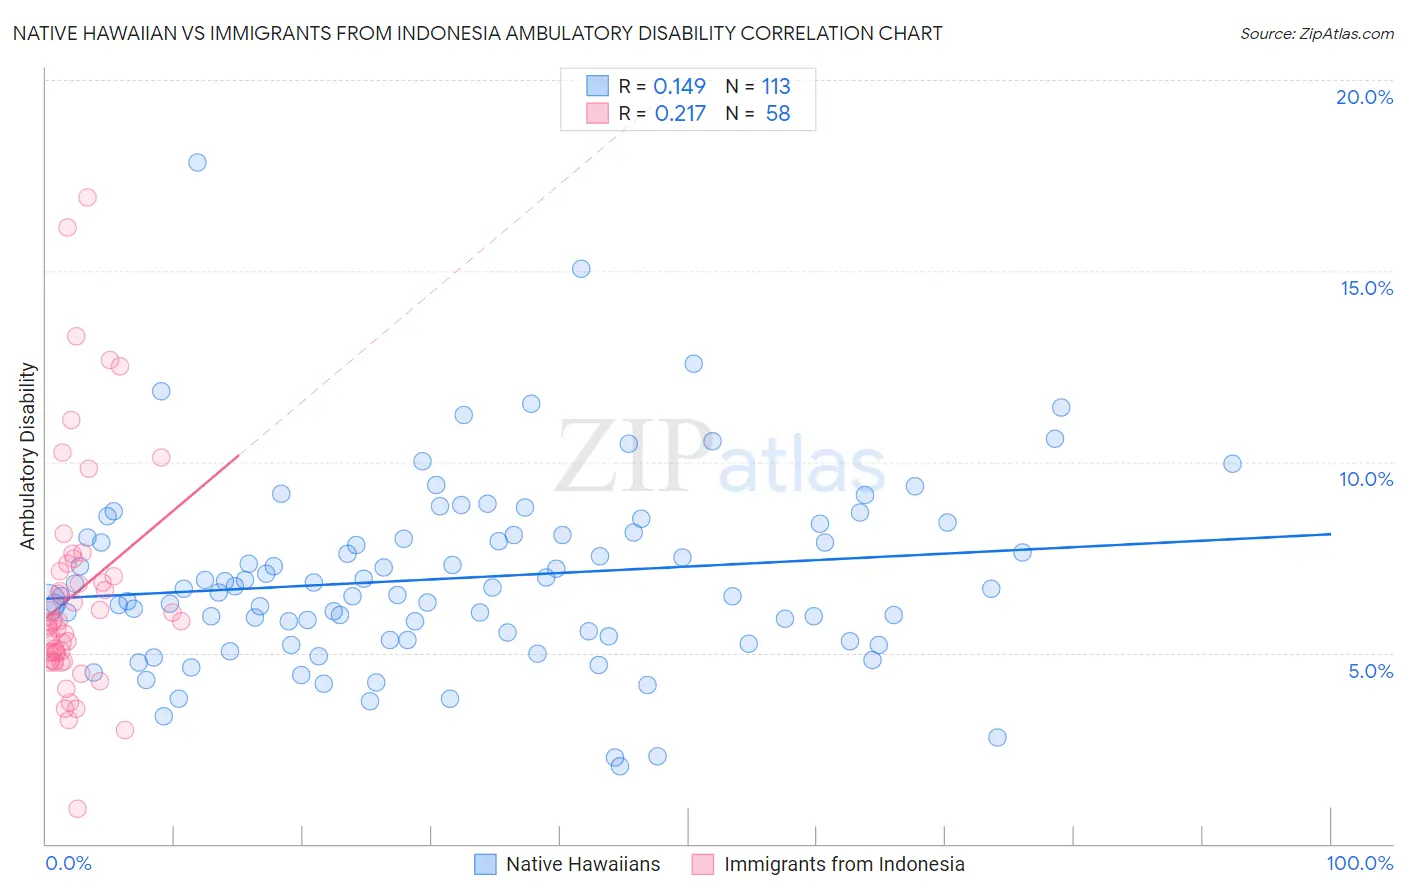
Native Hawaiian vs Immigrants from Indonesia Ambulatory Disability Correlation Chart
The statistical analysis conducted on geographies consisting of 331,921,721 people shows a poor positive correlation between the proportion of Native Hawaiians and percentage of population with ambulatory disability in the United States with a correlation coefficient (R) of 0.149 and weighted average of 6.5%. Similarly, the statistical analysis conducted on geographies consisting of 215,776,699 people shows a weak positive correlation between the proportion of Immigrants from Indonesia and percentage of population with ambulatory disability in the United States with a correlation coefficient (R) of 0.217 and weighted average of 5.5%, a difference of 16.9%.
Ambulatory Disability Correlation Summary
| Measurement | Native Hawaiian | Immigrants from Indonesia |
| Minimum | 2.0% | 0.92% |
| Maximum | 17.8% | 16.9% |
| Range | 15.8% | 16.0% |
| Mean | 6.9% | 6.5% |
| Median | 6.7% | 5.8% |
| Interquartile 25% (IQ1) | 5.4% | 4.8% |
| Interquartile 75% (IQ3) | 8.1% | 7.1% |
| Interquartile Range (IQR) | 2.7% | 2.3% |
| Standard Deviation (Sample) | 2.4% | 3.0% |
| Standard Deviation (Population) | 2.4% | 3.0% |
Similar Demographics by Ambulatory Disability
Demographics Similar to Native Hawaiians by Ambulatory Disability
In terms of ambulatory disability, the demographic groups most similar to Native Hawaiians are Chinese (6.5%, a difference of 0.080%), Hawaiian (6.5%, a difference of 0.26%), Immigrants from Portugal (6.5%, a difference of 0.28%), Immigrants from Cuba (6.5%, a difference of 0.30%), and Armenian (6.5%, a difference of 0.36%).
| Demographics | Rating | Rank | Ambulatory Disability |
| Spaniards | 1.6 /100 | #242 | Tragic 6.5% |
| Germans | 1.5 /100 | #243 | Tragic 6.5% |
| Immigrants | Panama | 1.5 /100 | #244 | Tragic 6.5% |
| Tlingit-Haida | 1.5 /100 | #245 | Tragic 6.5% |
| Armenians | 1.5 /100 | #246 | Tragic 6.5% |
| Immigrants | Cuba | 1.4 /100 | #247 | Tragic 6.5% |
| Immigrants | Portugal | 1.4 /100 | #248 | Tragic 6.5% |
| Native Hawaiians | 1.1 /100 | #249 | Tragic 6.5% |
| Chinese | 1.0 /100 | #250 | Tragic 6.5% |
| Hawaiians | 0.9 /100 | #251 | Tragic 6.5% |
| Immigrants | Bahamas | 0.8 /100 | #252 | Tragic 6.5% |
| Scottish | 0.7 /100 | #253 | Tragic 6.5% |
| Belizeans | 0.7 /100 | #254 | Tragic 6.5% |
| Welsh | 0.6 /100 | #255 | Tragic 6.5% |
| Immigrants | Uzbekistan | 0.6 /100 | #256 | Tragic 6.5% |
Demographics Similar to Immigrants from Indonesia by Ambulatory Disability
In terms of ambulatory disability, the demographic groups most similar to Immigrants from Indonesia are Paraguayan (5.5%, a difference of 0.12%), Immigrants from Sweden (5.6%, a difference of 0.17%), Egyptian (5.6%, a difference of 0.18%), Immigrants from Japan (5.6%, a difference of 0.18%), and Immigrants from Argentina (5.6%, a difference of 0.19%).
| Demographics | Rating | Rank | Ambulatory Disability |
| Turks | 100.0 /100 | #37 | Exceptional 5.5% |
| Cypriots | 100.0 /100 | #38 | Exceptional 5.5% |
| Immigrants | Eritrea | 100.0 /100 | #39 | Exceptional 5.5% |
| Venezuelans | 99.9 /100 | #40 | Exceptional 5.5% |
| Mongolians | 99.9 /100 | #41 | Exceptional 5.5% |
| Argentineans | 99.9 /100 | #42 | Exceptional 5.5% |
| Paraguayans | 99.9 /100 | #43 | Exceptional 5.5% |
| Immigrants | Indonesia | 99.9 /100 | #44 | Exceptional 5.5% |
| Immigrants | Sweden | 99.9 /100 | #45 | Exceptional 5.6% |
| Egyptians | 99.9 /100 | #46 | Exceptional 5.6% |
| Immigrants | Japan | 99.9 /100 | #47 | Exceptional 5.6% |
| Immigrants | Argentina | 99.9 /100 | #48 | Exceptional 5.6% |
| Bulgarians | 99.9 /100 | #49 | Exceptional 5.6% |
| Luxembourgers | 99.9 /100 | #50 | Exceptional 5.6% |
| Taiwanese | 99.8 /100 | #51 | Exceptional 5.6% |