Polish vs Immigrants from Australia Unemployment
COMPARE
Polish
Immigrants from Australia
Unemployment
Unemployment Comparison
Poles
Immigrants from Australia
4.7%
UNEMPLOYMENT
99.8/ 100
METRIC RATING
29th/ 347
METRIC RANK
5.0%
UNEMPLOYMENT
97.0/ 100
METRIC RATING
85th/ 347
METRIC RANK
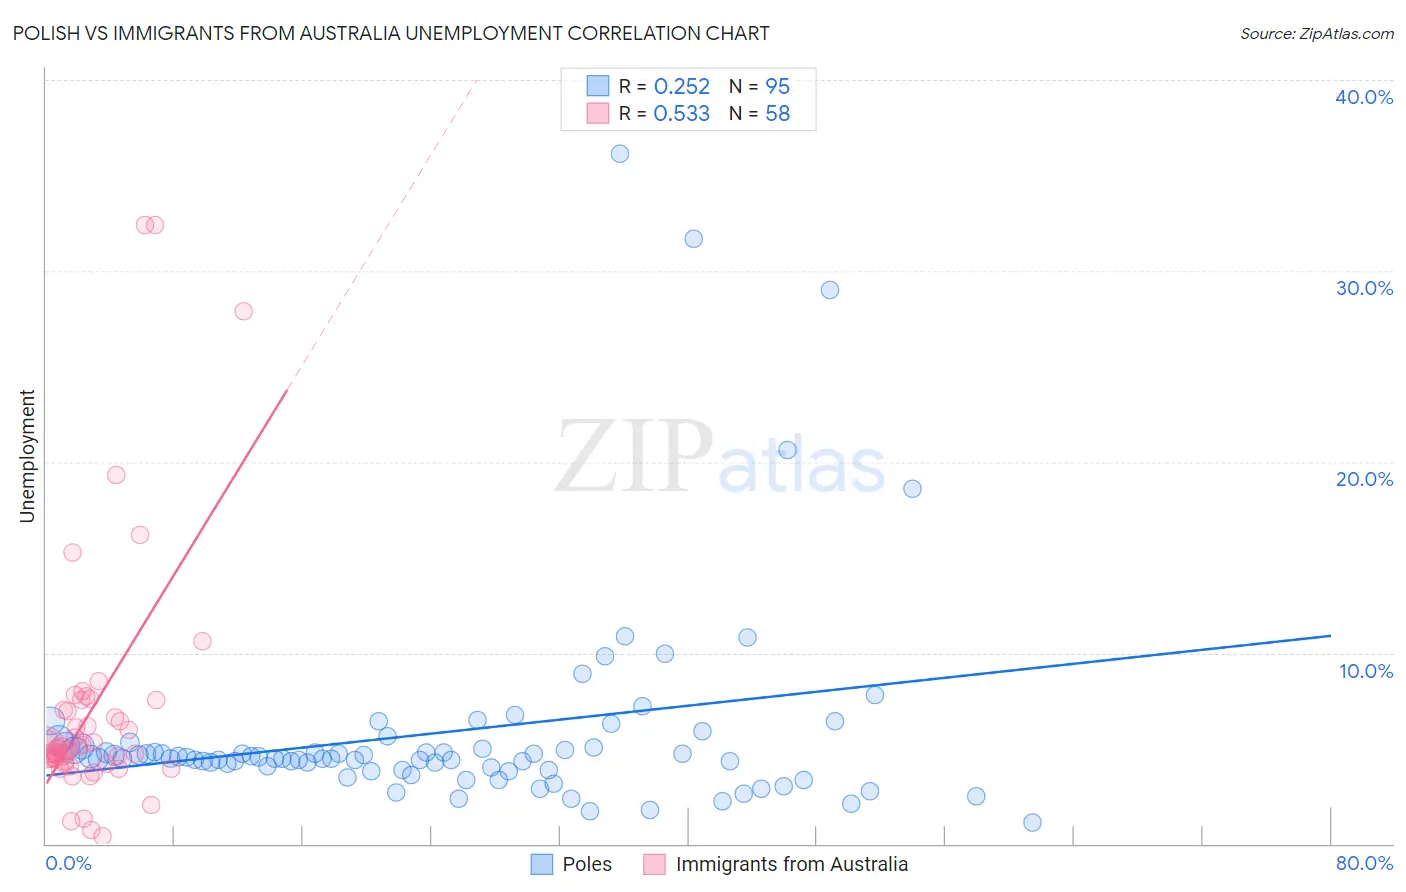
Polish vs Immigrants from Australia Unemployment Correlation Chart
The statistical analysis conducted on geographies consisting of 557,090,134 people shows a weak positive correlation between the proportion of Poles and unemployment in the United States with a correlation coefficient (R) of 0.252 and weighted average of 4.7%. Similarly, the statistical analysis conducted on geographies consisting of 227,110,462 people shows a substantial positive correlation between the proportion of Immigrants from Australia and unemployment in the United States with a correlation coefficient (R) of 0.533 and weighted average of 5.0%, a difference of 4.9%.
Unemployment Correlation Summary
| Measurement | Polish | Immigrants from Australia |
| Minimum | 1.1% | 0.40% |
| Maximum | 36.2% | 32.4% |
| Range | 35.1% | 32.0% |
| Mean | 5.8% | 7.0% |
| Median | 4.5% | 5.0% |
| Interquartile 25% (IQ1) | 3.9% | 4.3% |
| Interquartile 75% (IQ3) | 5.1% | 7.0% |
| Interquartile Range (IQR) | 1.2% | 2.7% |
| Standard Deviation (Sample) | 5.6% | 6.5% |
| Standard Deviation (Population) | 5.5% | 6.5% |
Similar Demographics by Unemployment
Demographics Similar to Poles by Unemployment
In terms of unemployment, the demographic groups most similar to Poles are Cuban (4.7%, a difference of 0.12%), Irish (4.8%, a difference of 0.24%), Croatian (4.8%, a difference of 0.26%), Zimbabwean (4.8%, a difference of 0.36%), and Sudanese (4.8%, a difference of 0.37%).
| Demographics | Rating | Rank | Unemployment |
| Thais | 99.9 /100 | #22 | Exceptional 4.7% |
| British | 99.9 /100 | #23 | Exceptional 4.7% |
| Venezuelans | 99.9 /100 | #24 | Exceptional 4.7% |
| Latvians | 99.9 /100 | #25 | Exceptional 4.7% |
| Bulgarians | 99.9 /100 | #26 | Exceptional 4.7% |
| Finns | 99.9 /100 | #27 | Exceptional 4.7% |
| Cubans | 99.8 /100 | #28 | Exceptional 4.7% |
| Poles | 99.8 /100 | #29 | Exceptional 4.7% |
| Irish | 99.8 /100 | #30 | Exceptional 4.8% |
| Croatians | 99.8 /100 | #31 | Exceptional 4.8% |
| Zimbabweans | 99.8 /100 | #32 | Exceptional 4.8% |
| Sudanese | 99.8 /100 | #33 | Exceptional 4.8% |
| Immigrants | Bolivia | 99.8 /100 | #34 | Exceptional 4.8% |
| Scotch-Irish | 99.8 /100 | #35 | Exceptional 4.8% |
| Tongans | 99.7 /100 | #36 | Exceptional 4.8% |
Demographics Similar to Immigrants from Australia by Unemployment
In terms of unemployment, the demographic groups most similar to Immigrants from Australia are Hungarian (5.0%, a difference of 0.030%), Immigrants from Moldova (5.0%, a difference of 0.18%), Immigrants from Korea (5.0%, a difference of 0.21%), Russian (5.0%, a difference of 0.28%), and Jordanian (5.0%, a difference of 0.30%).
| Demographics | Rating | Rank | Unemployment |
| Okinawans | 97.9 /100 | #78 | Exceptional 4.9% |
| Canadians | 97.7 /100 | #79 | Exceptional 5.0% |
| Immigrants | Sweden | 97.6 /100 | #80 | Exceptional 5.0% |
| Basques | 97.6 /100 | #81 | Exceptional 5.0% |
| Fijians | 97.6 /100 | #82 | Exceptional 5.0% |
| Hmong | 97.6 /100 | #83 | Exceptional 5.0% |
| Russians | 97.4 /100 | #84 | Exceptional 5.0% |
| Immigrants | Australia | 97.0 /100 | #85 | Exceptional 5.0% |
| Hungarians | 96.9 /100 | #86 | Exceptional 5.0% |
| Immigrants | Moldova | 96.6 /100 | #87 | Exceptional 5.0% |
| Immigrants | Korea | 96.6 /100 | #88 | Exceptional 5.0% |
| Jordanians | 96.4 /100 | #89 | Exceptional 5.0% |
| Immigrants | North Macedonia | 96.3 /100 | #90 | Exceptional 5.0% |
| Immigrants | Sudan | 96.3 /100 | #91 | Exceptional 5.0% |
| Immigrants | South Africa | 96.2 /100 | #92 | Exceptional 5.0% |