Slovak vs Immigrants from Kuwait Hearing Disability
COMPARE
Slovak
Immigrants from Kuwait
Hearing Disability
Hearing Disability Comparison
Slovaks
Immigrants from Kuwait
3.6%
HEARING DISABILITY
0.0/ 100
METRIC RATING
279th/ 347
METRIC RANK
2.8%
HEARING DISABILITY
96.3/ 100
METRIC RATING
93rd/ 347
METRIC RANK
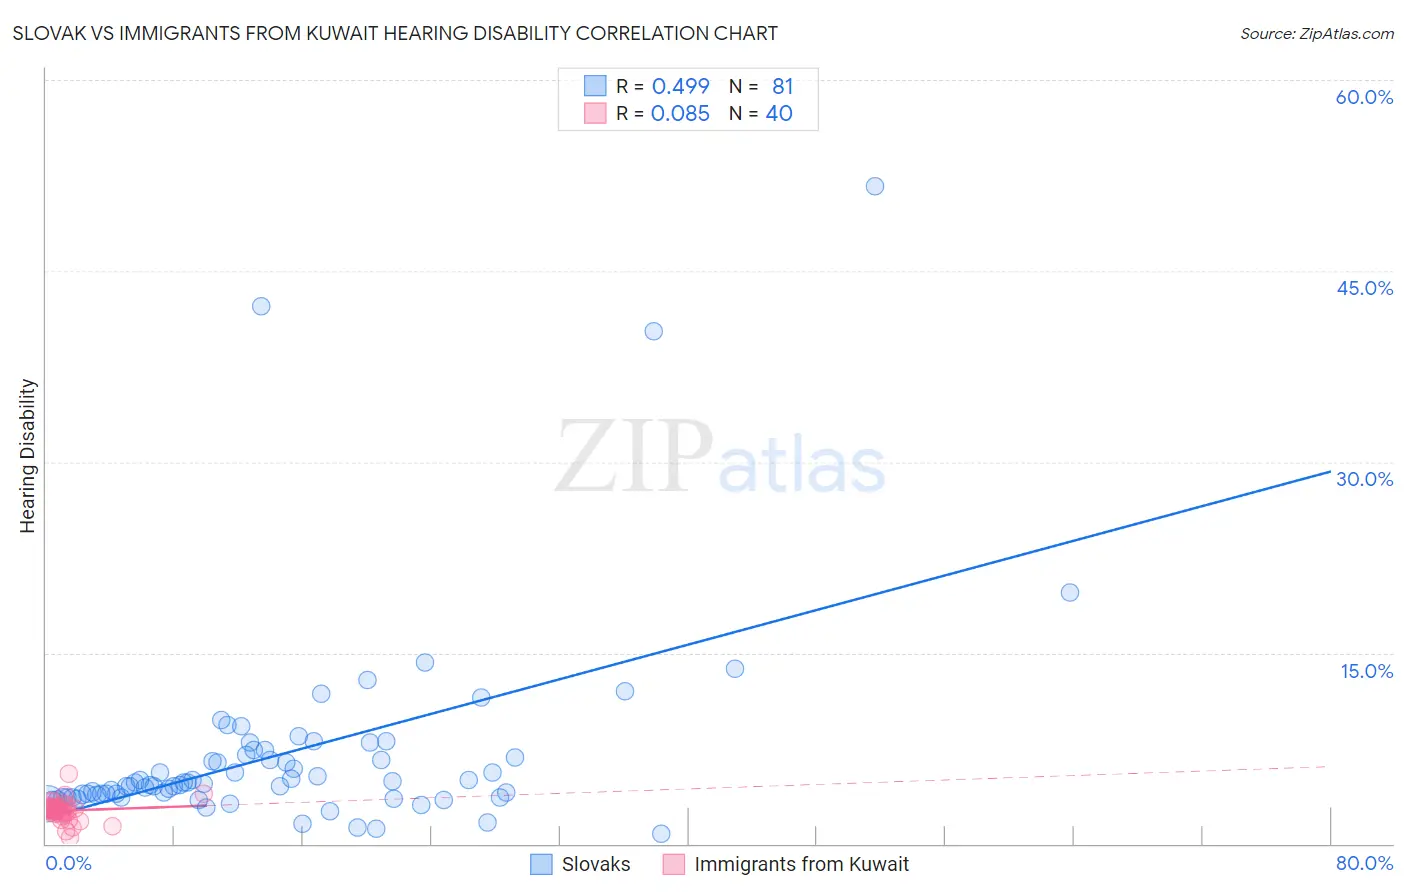
Slovak vs Immigrants from Kuwait Hearing Disability Correlation Chart
The statistical analysis conducted on geographies consisting of 397,764,457 people shows a moderate positive correlation between the proportion of Slovaks and percentage of population with hearing disability in the United States with a correlation coefficient (R) of 0.499 and weighted average of 3.6%. Similarly, the statistical analysis conducted on geographies consisting of 136,905,623 people shows a slight positive correlation between the proportion of Immigrants from Kuwait and percentage of population with hearing disability in the United States with a correlation coefficient (R) of 0.085 and weighted average of 2.8%, a difference of 30.3%.
Hearing Disability Correlation Summary
| Measurement | Slovak | Immigrants from Kuwait |
| Minimum | 0.74% | 0.48% |
| Maximum | 51.6% | 5.5% |
| Range | 50.9% | 5.0% |
| Mean | 7.1% | 2.6% |
| Median | 4.7% | 2.7% |
| Interquartile 25% (IQ1) | 3.7% | 2.4% |
| Interquartile 75% (IQ3) | 7.1% | 2.9% |
| Interquartile Range (IQR) | 3.5% | 0.46% |
| Standard Deviation (Sample) | 8.1% | 0.82% |
| Standard Deviation (Population) | 8.1% | 0.81% |
Similar Demographics by Hearing Disability
Demographics Similar to Slovaks by Hearing Disability
In terms of hearing disability, the demographic groups most similar to Slovaks are French American Indian (3.6%, a difference of 0.070%), Scandinavian (3.6%, a difference of 0.12%), Swedish (3.6%, a difference of 0.21%), Basque (3.6%, a difference of 0.26%), and Blackfeet (3.6%, a difference of 0.46%).
| Demographics | Rating | Rank | Hearing Disability |
| Fijians | 0.0 /100 | #272 | Tragic 3.5% |
| Puerto Ricans | 0.0 /100 | #273 | Tragic 3.5% |
| Swiss | 0.0 /100 | #274 | Tragic 3.5% |
| Czechoslovakians | 0.0 /100 | #275 | Tragic 3.6% |
| Danes | 0.0 /100 | #276 | Tragic 3.6% |
| Immigrants | Nonimmigrants | 0.0 /100 | #277 | Tragic 3.6% |
| Basques | 0.0 /100 | #278 | Tragic 3.6% |
| Slovaks | 0.0 /100 | #279 | Tragic 3.6% |
| French American Indians | 0.0 /100 | #280 | Tragic 3.6% |
| Scandinavians | 0.0 /100 | #281 | Tragic 3.6% |
| Swedes | 0.0 /100 | #282 | Tragic 3.6% |
| Blackfeet | 0.0 /100 | #283 | Tragic 3.6% |
| Immigrants | Micronesia | 0.0 /100 | #284 | Tragic 3.6% |
| Sioux | 0.0 /100 | #285 | Tragic 3.6% |
| Delaware | 0.0 /100 | #286 | Tragic 3.6% |
Demographics Similar to Immigrants from Kuwait by Hearing Disability
In terms of hearing disability, the demographic groups most similar to Immigrants from Kuwait are Iranian (2.8%, a difference of 0.12%), Immigrants from Middle Africa (2.8%, a difference of 0.15%), Immigrants from Morocco (2.8%, a difference of 0.23%), Belizean (2.8%, a difference of 0.26%), and Uruguayan (2.8%, a difference of 0.27%).
| Demographics | Rating | Rank | Hearing Disability |
| Immigrants | Iran | 96.8 /100 | #86 | Exceptional 2.8% |
| Somalis | 96.7 /100 | #87 | Exceptional 2.8% |
| Immigrants | Turkey | 96.7 /100 | #88 | Exceptional 2.8% |
| Belizeans | 96.6 /100 | #89 | Exceptional 2.8% |
| Immigrants | Morocco | 96.6 /100 | #90 | Exceptional 2.8% |
| Immigrants | Middle Africa | 96.5 /100 | #91 | Exceptional 2.8% |
| Iranians | 96.4 /100 | #92 | Exceptional 2.8% |
| Immigrants | Kuwait | 96.3 /100 | #93 | Exceptional 2.8% |
| Uruguayans | 95.9 /100 | #94 | Exceptional 2.8% |
| Israelis | 95.9 /100 | #95 | Exceptional 2.8% |
| Immigrants | Somalia | 95.5 /100 | #96 | Exceptional 2.8% |
| Immigrants | Afghanistan | 95.3 /100 | #97 | Exceptional 2.8% |
| Immigrants | Honduras | 95.1 /100 | #98 | Exceptional 2.8% |
| Immigrants | Guatemala | 95.1 /100 | #99 | Exceptional 2.8% |
| Immigrants | Eastern Africa | 95.0 /100 | #100 | Exceptional 2.8% |