Kiowa vs Immigrants from Kuwait Hearing Disability
COMPARE
Kiowa
Immigrants from Kuwait
Hearing Disability
Hearing Disability Comparison
Kiowa
Immigrants from Kuwait
4.3%
HEARING DISABILITY
0.0/ 100
METRIC RATING
335th/ 347
METRIC RANK
2.8%
HEARING DISABILITY
96.3/ 100
METRIC RATING
93rd/ 347
METRIC RANK
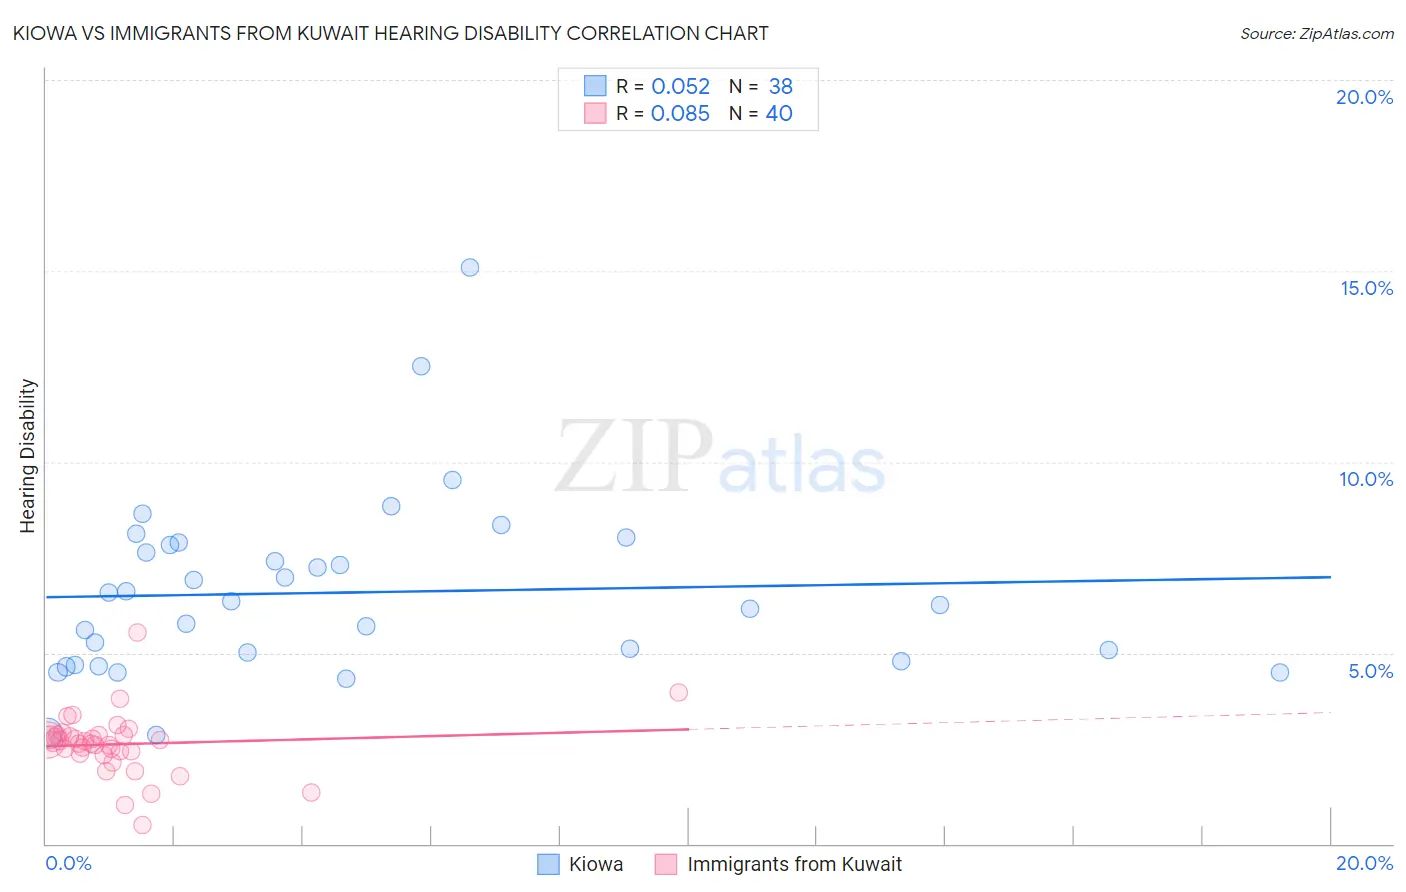
Kiowa vs Immigrants from Kuwait Hearing Disability Correlation Chart
The statistical analysis conducted on geographies consisting of 56,096,605 people shows a slight positive correlation between the proportion of Kiowa and percentage of population with hearing disability in the United States with a correlation coefficient (R) of 0.052 and weighted average of 4.3%. Similarly, the statistical analysis conducted on geographies consisting of 136,905,623 people shows a slight positive correlation between the proportion of Immigrants from Kuwait and percentage of population with hearing disability in the United States with a correlation coefficient (R) of 0.085 and weighted average of 2.8%, a difference of 56.8%.
Hearing Disability Correlation Summary
| Measurement | Kiowa | Immigrants from Kuwait |
| Minimum | 2.8% | 0.48% |
| Maximum | 15.1% | 5.5% |
| Range | 12.2% | 5.0% |
| Mean | 6.6% | 2.6% |
| Median | 6.3% | 2.7% |
| Interquartile 25% (IQ1) | 4.8% | 2.4% |
| Interquartile 75% (IQ3) | 7.8% | 2.9% |
| Interquartile Range (IQR) | 3.1% | 0.46% |
| Standard Deviation (Sample) | 2.4% | 0.82% |
| Standard Deviation (Population) | 2.4% | 0.81% |
Similar Demographics by Hearing Disability
Demographics Similar to Kiowa by Hearing Disability
In terms of hearing disability, the demographic groups most similar to Kiowa are Creek (4.4%, a difference of 0.71%), Aleut (4.3%, a difference of 1.3%), Dutch West Indian (4.3%, a difference of 1.9%), Houma (4.2%, a difference of 2.5%), and Cherokee (4.2%, a difference of 3.2%).
| Demographics | Rating | Rank | Hearing Disability |
| Tohono O'odham | 0.0 /100 | #328 | Tragic 4.2% |
| Crow | 0.0 /100 | #329 | Tragic 4.2% |
| Natives/Alaskans | 0.0 /100 | #330 | Tragic 4.2% |
| Cherokee | 0.0 /100 | #331 | Tragic 4.2% |
| Houma | 0.0 /100 | #332 | Tragic 4.2% |
| Dutch West Indians | 0.0 /100 | #333 | Tragic 4.3% |
| Aleuts | 0.0 /100 | #334 | Tragic 4.3% |
| Kiowa | 0.0 /100 | #335 | Tragic 4.3% |
| Creek | 0.0 /100 | #336 | Tragic 4.4% |
| Chickasaw | 0.0 /100 | #337 | Tragic 4.5% |
| Alaska Natives | 0.0 /100 | #338 | Tragic 4.5% |
| Choctaw | 0.0 /100 | #339 | Tragic 4.5% |
| Pueblo | 0.0 /100 | #340 | Tragic 4.6% |
| Navajo | 0.0 /100 | #341 | Tragic 4.6% |
| Tsimshian | 0.0 /100 | #342 | Tragic 4.7% |
Demographics Similar to Immigrants from Kuwait by Hearing Disability
In terms of hearing disability, the demographic groups most similar to Immigrants from Kuwait are Iranian (2.8%, a difference of 0.12%), Immigrants from Middle Africa (2.8%, a difference of 0.15%), Immigrants from Morocco (2.8%, a difference of 0.23%), Belizean (2.8%, a difference of 0.26%), and Uruguayan (2.8%, a difference of 0.27%).
| Demographics | Rating | Rank | Hearing Disability |
| Immigrants | Iran | 96.8 /100 | #86 | Exceptional 2.8% |
| Somalis | 96.7 /100 | #87 | Exceptional 2.8% |
| Immigrants | Turkey | 96.7 /100 | #88 | Exceptional 2.8% |
| Belizeans | 96.6 /100 | #89 | Exceptional 2.8% |
| Immigrants | Morocco | 96.6 /100 | #90 | Exceptional 2.8% |
| Immigrants | Middle Africa | 96.5 /100 | #91 | Exceptional 2.8% |
| Iranians | 96.4 /100 | #92 | Exceptional 2.8% |
| Immigrants | Kuwait | 96.3 /100 | #93 | Exceptional 2.8% |
| Uruguayans | 95.9 /100 | #94 | Exceptional 2.8% |
| Israelis | 95.9 /100 | #95 | Exceptional 2.8% |
| Immigrants | Somalia | 95.5 /100 | #96 | Exceptional 2.8% |
| Immigrants | Afghanistan | 95.3 /100 | #97 | Exceptional 2.8% |
| Immigrants | Honduras | 95.1 /100 | #98 | Exceptional 2.8% |
| Immigrants | Guatemala | 95.1 /100 | #99 | Exceptional 2.8% |
| Immigrants | Eastern Africa | 95.0 /100 | #100 | Exceptional 2.8% |