Pima vs Immigrants from Kuwait 1st Grade
COMPARE
Pima
Immigrants from Kuwait
1st Grade
1st Grade Comparison
Pima
Immigrants from Kuwait
98.2%
1ST GRADE
97.5/ 100
METRIC RATING
104th/ 347
METRIC RANK
98.1%
1ST GRADE
89.3/ 100
METRIC RATING
135th/ 347
METRIC RANK
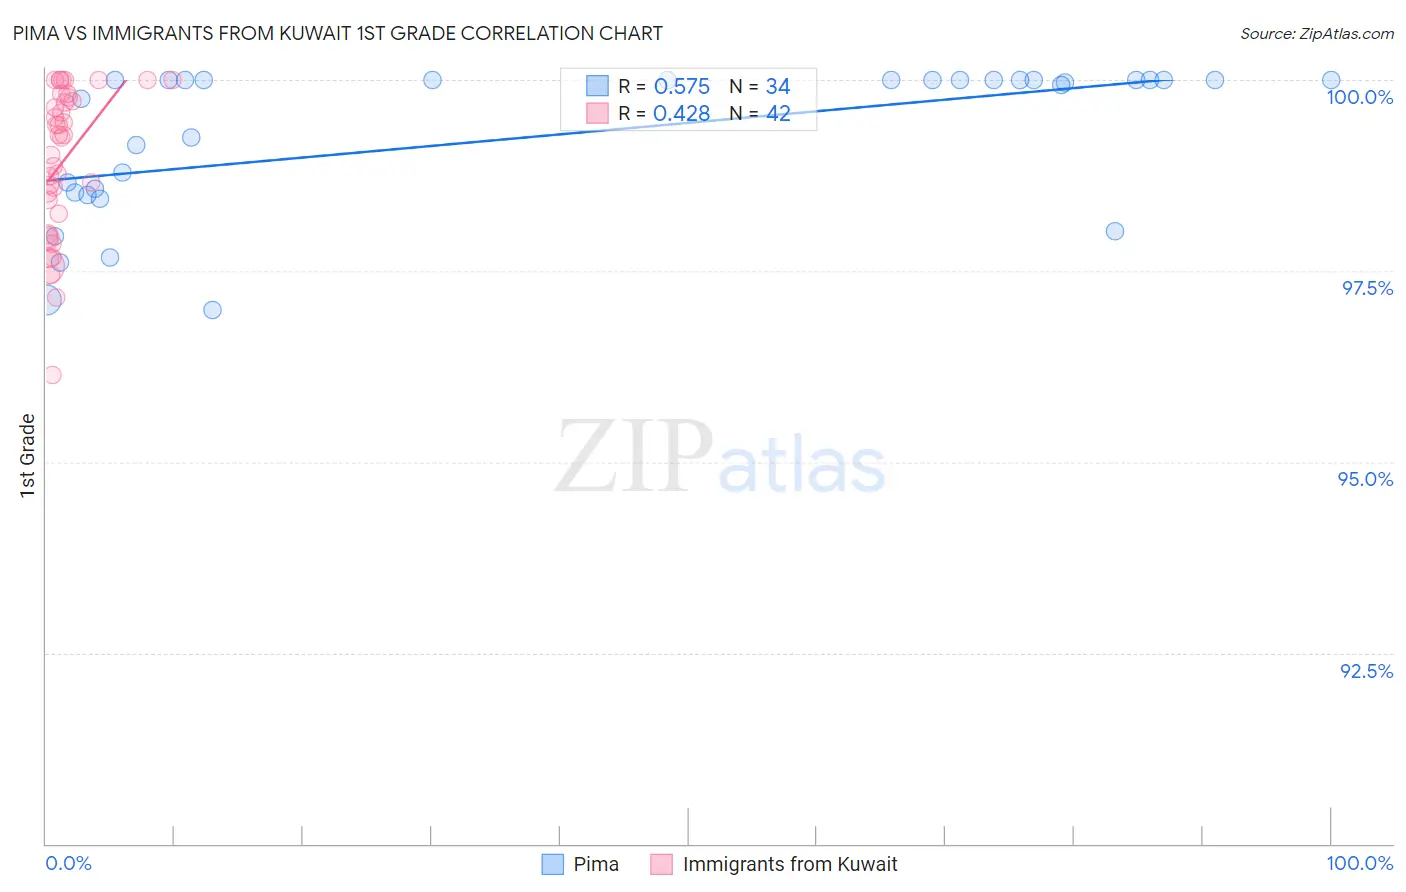
Pima vs Immigrants from Kuwait 1st Grade Correlation Chart
The statistical analysis conducted on geographies consisting of 61,552,942 people shows a substantial positive correlation between the proportion of Pima and percentage of population with at least 1st grade education in the United States with a correlation coefficient (R) of 0.575 and weighted average of 98.2%. Similarly, the statistical analysis conducted on geographies consisting of 136,913,666 people shows a moderate positive correlation between the proportion of Immigrants from Kuwait and percentage of population with at least 1st grade education in the United States with a correlation coefficient (R) of 0.428 and weighted average of 98.1%, a difference of 0.12%.
1st Grade Correlation Summary
| Measurement | Pima | Immigrants from Kuwait |
| Minimum | 97.0% | 96.1% |
| Maximum | 100.0% | 100.0% |
| Range | 3.0% | 3.9% |
| Mean | 99.3% | 98.9% |
| Median | 100.0% | 99.3% |
| Interquartile 25% (IQ1) | 98.5% | 98.2% |
| Interquartile 75% (IQ3) | 100.0% | 99.8% |
| Interquartile Range (IQR) | 1.5% | 1.5% |
| Standard Deviation (Sample) | 0.98% | 0.97% |
| Standard Deviation (Population) | 0.96% | 0.96% |
Similar Demographics by 1st Grade
Demographics Similar to Pima by 1st Grade
In terms of 1st grade, the demographic groups most similar to Pima are Basque (98.2%, a difference of 0.0%), Turkish (98.2%, a difference of 0.0%), Romanian (98.2%, a difference of 0.010%), Cree (98.2%, a difference of 0.010%), and Immigrants from Ireland (98.2%, a difference of 0.010%).
| Demographics | Rating | Rank | 1st Grade |
| Immigrants | Nonimmigrants | 98.3 /100 | #97 | Exceptional 98.2% |
| Choctaw | 98.3 /100 | #98 | Exceptional 98.2% |
| Puget Sound Salish | 98.2 /100 | #99 | Exceptional 98.2% |
| Colville | 98.0 /100 | #100 | Exceptional 98.2% |
| Romanians | 97.8 /100 | #101 | Exceptional 98.2% |
| Cree | 97.8 /100 | #102 | Exceptional 98.2% |
| Immigrants | Ireland | 97.7 /100 | #103 | Exceptional 98.2% |
| Pima | 97.5 /100 | #104 | Exceptional 98.2% |
| Basques | 97.4 /100 | #105 | Exceptional 98.2% |
| Turks | 97.4 /100 | #106 | Exceptional 98.2% |
| Immigrants | Switzerland | 97.3 /100 | #107 | Exceptional 98.2% |
| Bhutanese | 97.3 /100 | #108 | Exceptional 98.2% |
| German Russians | 97.1 /100 | #109 | Exceptional 98.2% |
| Immigrants | Singapore | 96.7 /100 | #110 | Exceptional 98.2% |
| Immigrants | Czechoslovakia | 96.6 /100 | #111 | Exceptional 98.2% |
Demographics Similar to Immigrants from Kuwait by 1st Grade
In terms of 1st grade, the demographic groups most similar to Immigrants from Kuwait are Immigrants from Hungary (98.1%, a difference of 0.0%), Immigrants from Bulgaria (98.1%, a difference of 0.0%), Cambodian (98.1%, a difference of 0.010%), Immigrants from Europe (98.1%, a difference of 0.010%), and Israeli (98.1%, a difference of 0.010%).
| Demographics | Rating | Rank | 1st Grade |
| Immigrants | Serbia | 92.2 /100 | #128 | Exceptional 98.1% |
| Seminole | 91.9 /100 | #129 | Exceptional 98.1% |
| Immigrants | Croatia | 91.4 /100 | #130 | Exceptional 98.1% |
| Spaniards | 91.2 /100 | #131 | Exceptional 98.1% |
| Cambodians | 90.9 /100 | #132 | Exceptional 98.1% |
| Immigrants | Europe | 90.5 /100 | #133 | Exceptional 98.1% |
| Immigrants | Hungary | 89.4 /100 | #134 | Excellent 98.1% |
| Immigrants | Kuwait | 89.3 /100 | #135 | Excellent 98.1% |
| Immigrants | Bulgaria | 88.8 /100 | #136 | Excellent 98.1% |
| Israelis | 87.8 /100 | #137 | Excellent 98.1% |
| Immigrants | Romania | 87.8 /100 | #138 | Excellent 98.1% |
| Blackfeet | 87.6 /100 | #139 | Excellent 98.1% |
| Palestinians | 83.0 /100 | #140 | Excellent 98.0% |
| Immigrants | Turkey | 82.8 /100 | #141 | Excellent 98.0% |
| Marshallese | 82.0 /100 | #142 | Excellent 98.0% |