Pima vs Immigrants from Guyana Householder Income Over 65 years
COMPARE
Pima
Immigrants from Guyana
Householder Income Over 65 years
Householder Income Over 65 years Comparison
Pima
Immigrants from Guyana
$50,539
HOUSEHOLDER INCOME OVER 65 YEARS
0.0/ 100
METRIC RATING
331st/ 347
METRIC RANK
$56,495
HOUSEHOLDER INCOME OVER 65 YEARS
0.9/ 100
METRIC RATING
241st/ 347
METRIC RANK
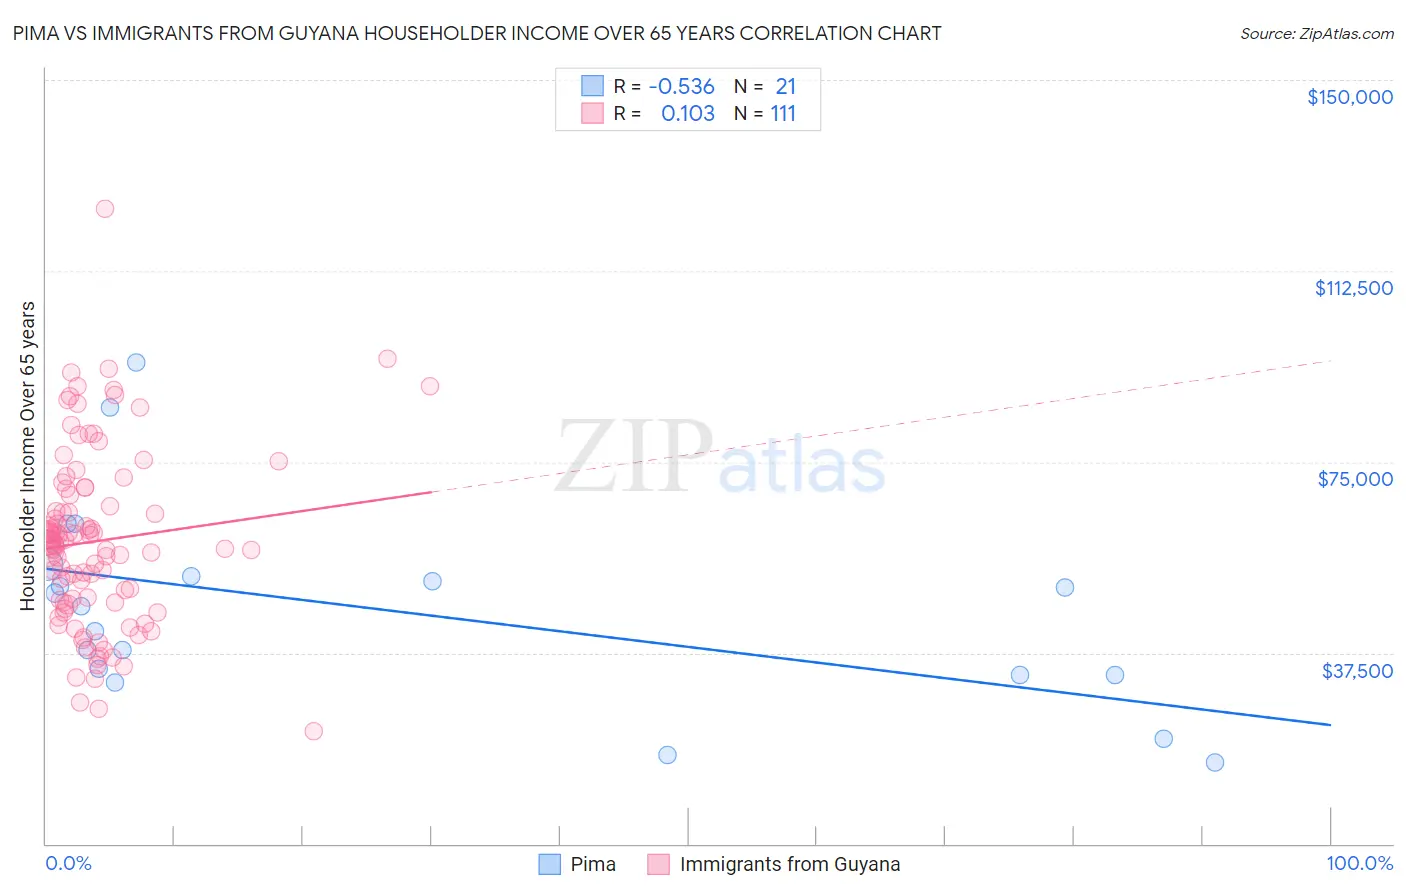
Pima vs Immigrants from Guyana Householder Income Over 65 years Correlation Chart
The statistical analysis conducted on geographies consisting of 61,493,441 people shows a substantial negative correlation between the proportion of Pima and household income with householder over the age of 65 in the United States with a correlation coefficient (R) of -0.536 and weighted average of $50,539. Similarly, the statistical analysis conducted on geographies consisting of 183,323,030 people shows a poor positive correlation between the proportion of Immigrants from Guyana and household income with householder over the age of 65 in the United States with a correlation coefficient (R) of 0.103 and weighted average of $56,495, a difference of 11.8%.
Householder Income Over 65 years Correlation Summary
| Measurement | Pima | Immigrants from Guyana |
| Minimum | $15,972 | $22,090 |
| Maximum | $94,583 | $124,816 |
| Range | $78,611 | $102,726 |
| Mean | $45,976 | $59,437 |
| Median | $46,564 | $58,833 |
| Interquartile 25% (IQ1) | $33,050 | $47,500 |
| Interquartile 75% (IQ3) | $53,656 | $68,572 |
| Interquartile Range (IQR) | $20,606 | $21,072 |
| Standard Deviation (Sample) | $19,860 | $17,169 |
| Standard Deviation (Population) | $19,381 | $17,091 |
Similar Demographics by Householder Income Over 65 years
Demographics Similar to Pima by Householder Income Over 65 years
In terms of householder income over 65 years, the demographic groups most similar to Pima are Dutch West Indian ($50,475, a difference of 0.13%), Immigrants from Grenada ($50,747, a difference of 0.41%), Black/African American ($50,779, a difference of 0.47%), Hopi ($50,925, a difference of 0.76%), and Bahamian ($51,000, a difference of 0.91%).
| Demographics | Rating | Rank | Householder Income Over 65 years |
| Immigrants | Congo | 0.0 /100 | #324 | Tragic $51,393 |
| Immigrants | Haiti | 0.0 /100 | #325 | Tragic $51,219 |
| Kiowa | 0.0 /100 | #326 | Tragic $51,140 |
| Bahamians | 0.0 /100 | #327 | Tragic $51,000 |
| Hopi | 0.0 /100 | #328 | Tragic $50,925 |
| Blacks/African Americans | 0.0 /100 | #329 | Tragic $50,779 |
| Immigrants | Grenada | 0.0 /100 | #330 | Tragic $50,747 |
| Pima | 0.0 /100 | #331 | Tragic $50,539 |
| Dutch West Indians | 0.0 /100 | #332 | Tragic $50,475 |
| Cape Verdeans | 0.0 /100 | #333 | Tragic $50,077 |
| Immigrants | Dominica | 0.0 /100 | #334 | Tragic $50,071 |
| Crow | 0.0 /100 | #335 | Tragic $49,234 |
| Cubans | 0.0 /100 | #336 | Tragic $49,152 |
| Tohono O'odham | 0.0 /100 | #337 | Tragic $49,121 |
| Immigrants | Caribbean | 0.0 /100 | #338 | Tragic $48,535 |
Demographics Similar to Immigrants from Guyana by Householder Income Over 65 years
In terms of householder income over 65 years, the demographic groups most similar to Immigrants from Guyana are Yaqui ($56,417, a difference of 0.14%), Subsaharan African ($56,615, a difference of 0.21%), Guyanese ($56,351, a difference of 0.26%), Hmong ($56,339, a difference of 0.28%), and Immigrants from Uzbekistan ($56,331, a difference of 0.29%).
| Demographics | Rating | Rank | Householder Income Over 65 years |
| Immigrants | Burma/Myanmar | 1.7 /100 | #234 | Tragic $57,114 |
| Spanish Americans | 1.6 /100 | #235 | Tragic $57,021 |
| Immigrants | Uruguay | 1.5 /100 | #236 | Tragic $56,975 |
| Immigrants | Panama | 1.5 /100 | #237 | Tragic $56,944 |
| Fijians | 1.2 /100 | #238 | Tragic $56,768 |
| Immigrants | Laos | 1.2 /100 | #239 | Tragic $56,722 |
| Sub-Saharan Africans | 1.0 /100 | #240 | Tragic $56,615 |
| Immigrants | Guyana | 0.9 /100 | #241 | Tragic $56,495 |
| Yaqui | 0.8 /100 | #242 | Tragic $56,417 |
| Guyanese | 0.8 /100 | #243 | Tragic $56,351 |
| Hmong | 0.8 /100 | #244 | Tragic $56,339 |
| Immigrants | Uzbekistan | 0.8 /100 | #245 | Tragic $56,331 |
| Central Americans | 0.8 /100 | #246 | Tragic $56,321 |
| Yakama | 0.7 /100 | #247 | Tragic $56,234 |
| Vietnamese | 0.6 /100 | #248 | Tragic $56,143 |