Pima vs Immigrants from Cameroon 11th Grade
COMPARE
Pima
Immigrants from Cameroon
11th Grade
11th Grade Comparison
Pima
Immigrants from Cameroon
88.3%
11TH GRADE
0.0/ 100
METRIC RATING
323rd/ 347
METRIC RANK
91.8%
11TH GRADE
4.4/ 100
METRIC RATING
227th/ 347
METRIC RANK
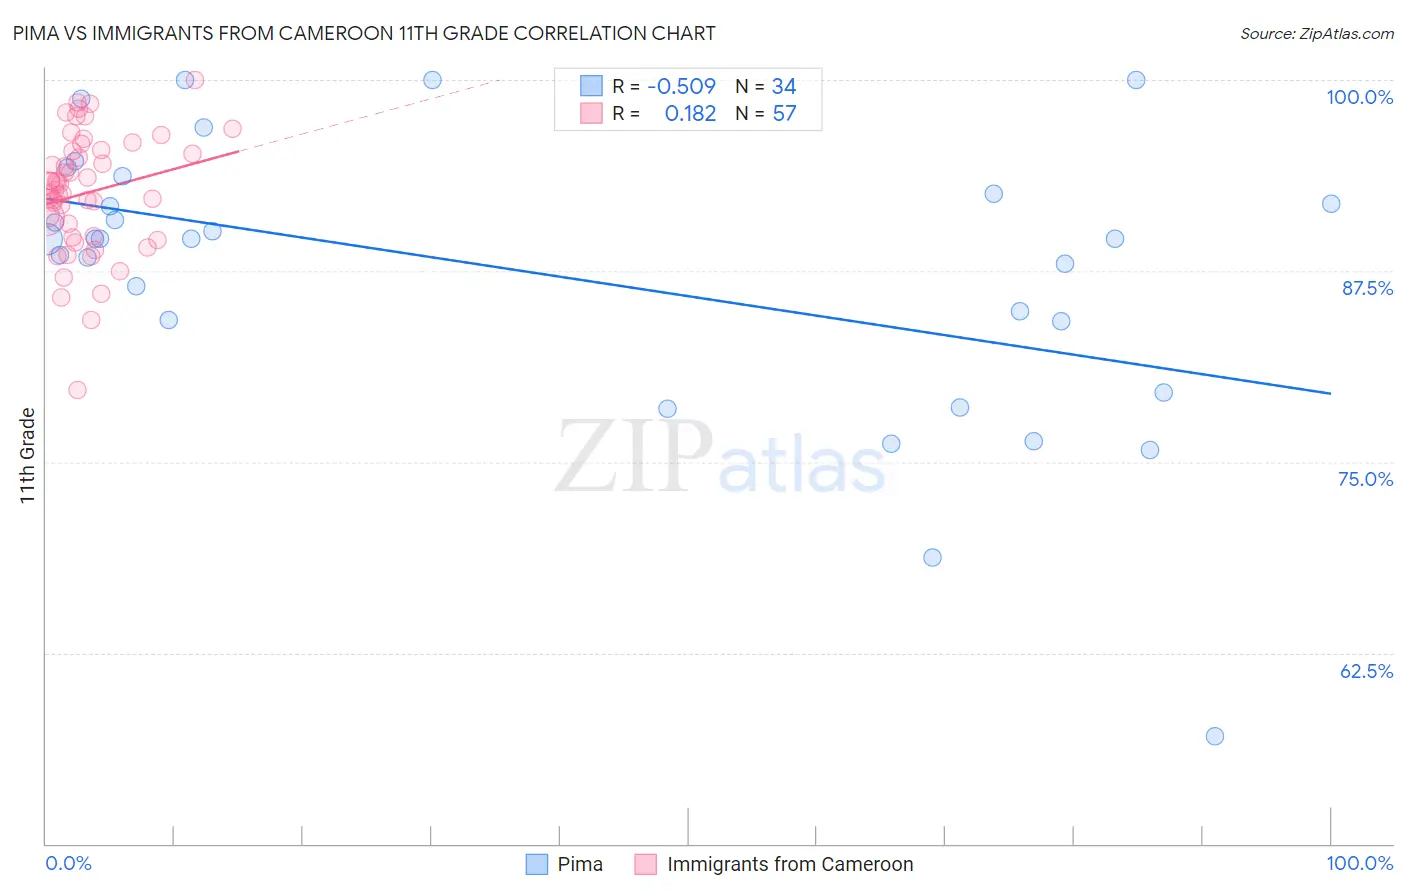
Pima vs Immigrants from Cameroon 11th Grade Correlation Chart
The statistical analysis conducted on geographies consisting of 61,552,942 people shows a substantial negative correlation between the proportion of Pima and percentage of population with at least 11th grade education in the United States with a correlation coefficient (R) of -0.509 and weighted average of 88.3%. Similarly, the statistical analysis conducted on geographies consisting of 130,618,704 people shows a poor positive correlation between the proportion of Immigrants from Cameroon and percentage of population with at least 11th grade education in the United States with a correlation coefficient (R) of 0.182 and weighted average of 91.8%, a difference of 4.0%.
11th Grade Correlation Summary
| Measurement | Pima | Immigrants from Cameroon |
| Minimum | 57.0% | 79.7% |
| Maximum | 100.0% | 100.0% |
| Range | 43.0% | 20.3% |
| Mean | 87.3% | 92.6% |
| Median | 89.6% | 92.8% |
| Interquartile 25% (IQ1) | 84.2% | 89.7% |
| Interquartile 75% (IQ3) | 92.6% | 95.4% |
| Interquartile Range (IQR) | 8.4% | 5.7% |
| Standard Deviation (Sample) | 9.3% | 3.9% |
| Standard Deviation (Population) | 9.2% | 3.9% |
Similar Demographics by 11th Grade
Demographics Similar to Pima by 11th Grade
In terms of 11th grade, the demographic groups most similar to Pima are Central American Indian (88.2%, a difference of 0.040%), Puerto Rican (88.4%, a difference of 0.080%), Immigrants from Nicaragua (88.1%, a difference of 0.17%), Immigrants from Belize (88.7%, a difference of 0.47%), and Immigrants from Armenia (88.8%, a difference of 0.55%).
| Demographics | Rating | Rank | 11th Grade |
| Immigrants | Cuba | 0.0 /100 | #316 | Tragic 88.9% |
| Lumbee | 0.0 /100 | #317 | Tragic 88.9% |
| Nicaraguans | 0.0 /100 | #318 | Tragic 88.9% |
| Belizeans | 0.0 /100 | #319 | Tragic 88.8% |
| Immigrants | Armenia | 0.0 /100 | #320 | Tragic 88.8% |
| Immigrants | Belize | 0.0 /100 | #321 | Tragic 88.7% |
| Puerto Ricans | 0.0 /100 | #322 | Tragic 88.4% |
| Pima | 0.0 /100 | #323 | Tragic 88.3% |
| Central American Indians | 0.0 /100 | #324 | Tragic 88.2% |
| Immigrants | Nicaragua | 0.0 /100 | #325 | Tragic 88.1% |
| Dominicans | 0.0 /100 | #326 | Tragic 87.7% |
| Immigrants | Cabo Verde | 0.0 /100 | #327 | Tragic 87.6% |
| Tohono O'odham | 0.0 /100 | #328 | Tragic 87.6% |
| Mexican American Indians | 0.0 /100 | #329 | Tragic 87.5% |
| Hondurans | 0.0 /100 | #330 | Tragic 87.4% |
Demographics Similar to Immigrants from Cameroon by 11th Grade
In terms of 11th grade, the demographic groups most similar to Immigrants from Cameroon are Immigrants from Panama (91.8%, a difference of 0.0%), Nigerian (91.8%, a difference of 0.010%), Immigrants from Afghanistan (91.8%, a difference of 0.030%), Choctaw (91.8%, a difference of 0.040%), and Immigrants from Somalia (91.9%, a difference of 0.050%).
| Demographics | Rating | Rank | 11th Grade |
| South American Indians | 7.6 /100 | #220 | Tragic 92.0% |
| Immigrants | Liberia | 7.0 /100 | #221 | Tragic 91.9% |
| Immigrants | Africa | 6.5 /100 | #222 | Tragic 91.9% |
| Immigrants | Bahamas | 6.5 /100 | #223 | Tragic 91.9% |
| Costa Ricans | 6.3 /100 | #224 | Tragic 91.9% |
| Immigrants | Zaire | 5.4 /100 | #225 | Tragic 91.9% |
| Immigrants | Somalia | 5.2 /100 | #226 | Tragic 91.9% |
| Immigrants | Cameroon | 4.4 /100 | #227 | Tragic 91.8% |
| Immigrants | Panama | 4.3 /100 | #228 | Tragic 91.8% |
| Nigerians | 4.3 /100 | #229 | Tragic 91.8% |
| Immigrants | Afghanistan | 3.9 /100 | #230 | Tragic 91.8% |
| Choctaw | 3.7 /100 | #231 | Tragic 91.8% |
| Uruguayans | 3.5 /100 | #232 | Tragic 91.8% |
| Cheyenne | 3.3 /100 | #233 | Tragic 91.8% |
| Armenians | 2.9 /100 | #234 | Tragic 91.7% |