Immigrants from Belize vs Belgian Disability
COMPARE
Immigrants from Belize
Belgian
Disability
Disability Comparison
Immigrants from Belize
Belgians
11.9%
DISABILITY
15.2/ 100
METRIC RATING
197th/ 347
METRIC RANK
12.3%
DISABILITY
0.8/ 100
METRIC RATING
253rd/ 347
METRIC RANK
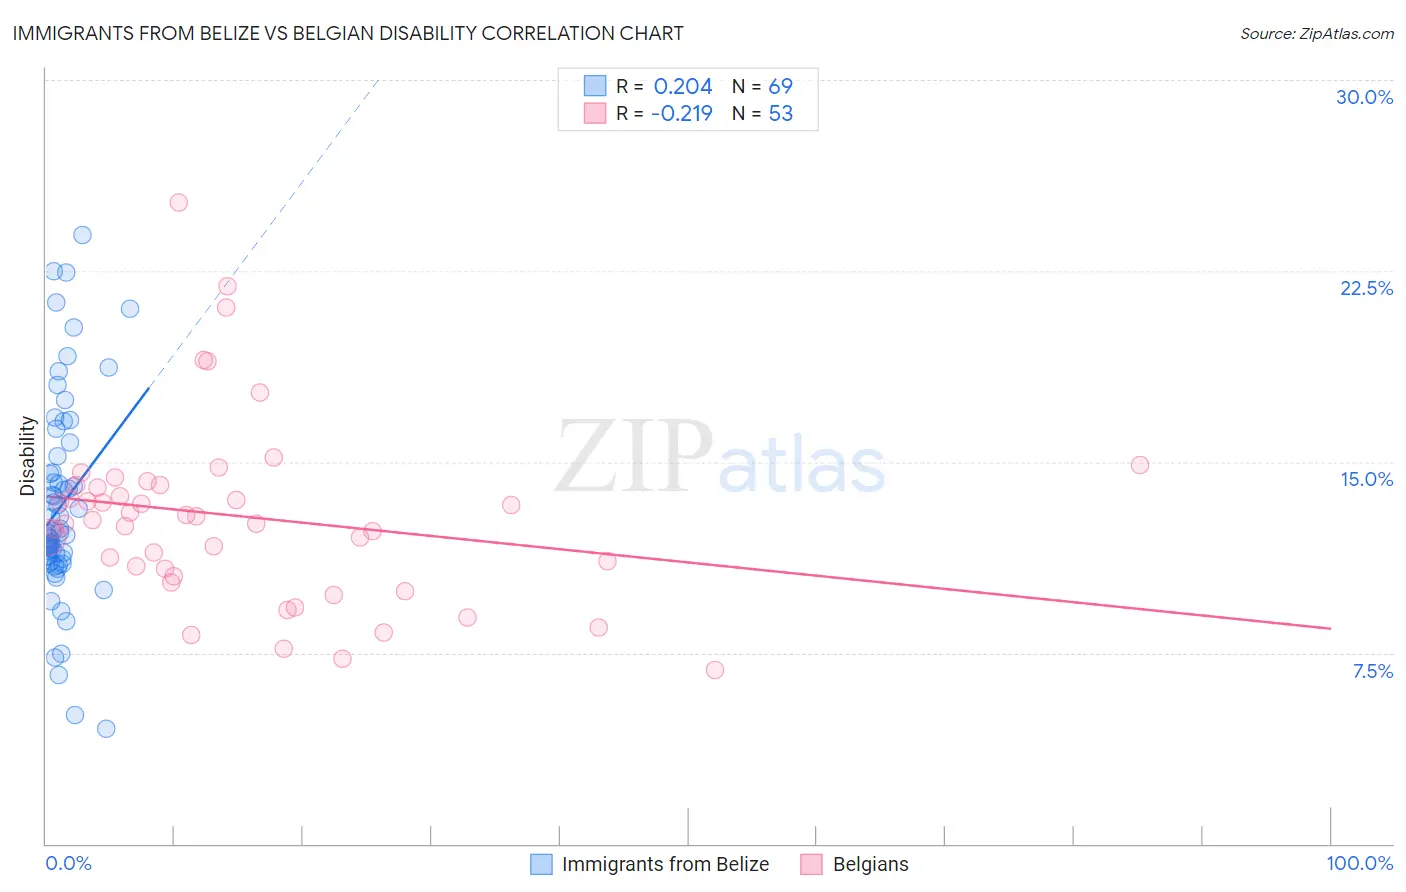
Immigrants from Belize vs Belgian Disability Correlation Chart
The statistical analysis conducted on geographies consisting of 130,304,390 people shows a weak positive correlation between the proportion of Immigrants from Belize and percentage of population with a disability in the United States with a correlation coefficient (R) of 0.204 and weighted average of 11.9%. Similarly, the statistical analysis conducted on geographies consisting of 355,995,745 people shows a weak negative correlation between the proportion of Belgians and percentage of population with a disability in the United States with a correlation coefficient (R) of -0.219 and weighted average of 12.3%, a difference of 3.3%.
Disability Correlation Summary
| Measurement | Immigrants from Belize | Belgian |
| Minimum | 4.5% | 6.8% |
| Maximum | 23.9% | 25.2% |
| Range | 19.4% | 18.3% |
| Mean | 13.3% | 12.9% |
| Median | 12.2% | 12.7% |
| Interquartile 25% (IQ1) | 11.2% | 10.7% |
| Interquartile 75% (IQ3) | 14.9% | 14.1% |
| Interquartile Range (IQR) | 3.8% | 3.4% |
| Standard Deviation (Sample) | 4.0% | 3.6% |
| Standard Deviation (Population) | 3.9% | 3.6% |
Similar Demographics by Disability
Demographics Similar to Immigrants from Belize by Disability
In terms of disability, the demographic groups most similar to Immigrants from Belize are Serbian (11.9%, a difference of 0.010%), Barbadian (11.9%, a difference of 0.050%), Ukrainian (11.9%, a difference of 0.050%), Immigrants from Panama (11.9%, a difference of 0.050%), and Somali (11.9%, a difference of 0.17%).
| Demographics | Rating | Rank | Disability |
| Immigrants | West Indies | 21.1 /100 | #190 | Fair 11.9% |
| Ute | 19.5 /100 | #191 | Poor 11.9% |
| Lithuanians | 18.8 /100 | #192 | Poor 11.9% |
| Immigrants | Bosnia and Herzegovina | 18.0 /100 | #193 | Poor 11.9% |
| Somalis | 17.3 /100 | #194 | Poor 11.9% |
| Barbadians | 15.8 /100 | #195 | Poor 11.9% |
| Serbians | 15.4 /100 | #196 | Poor 11.9% |
| Immigrants | Belize | 15.2 /100 | #197 | Poor 11.9% |
| Ukrainians | 14.7 /100 | #198 | Poor 11.9% |
| Immigrants | Panama | 14.6 /100 | #199 | Poor 11.9% |
| Belizeans | 12.8 /100 | #200 | Poor 11.9% |
| Assyrians/Chaldeans/Syriacs | 12.6 /100 | #201 | Poor 11.9% |
| Immigrants | England | 12.0 /100 | #202 | Poor 12.0% |
| British West Indians | 11.5 /100 | #203 | Poor 12.0% |
| Mexican American Indians | 11.4 /100 | #204 | Poor 12.0% |
Demographics Similar to Belgians by Disability
In terms of disability, the demographic groups most similar to Belgians are German Russian (12.3%, a difference of 0.030%), Bermudan (12.3%, a difference of 0.31%), Slovene (12.4%, a difference of 0.35%), Immigrants from Dominica (12.4%, a difference of 0.42%), and Subsaharan African (12.3%, a difference of 0.50%).
| Demographics | Rating | Rank | Disability |
| Swiss | 1.5 /100 | #246 | Tragic 12.2% |
| Indonesians | 1.4 /100 | #247 | Tragic 12.2% |
| Guamanians/Chamorros | 1.4 /100 | #248 | Tragic 12.3% |
| Carpatho Rusyns | 1.4 /100 | #249 | Tragic 12.3% |
| Sub-Saharan Africans | 1.4 /100 | #250 | Tragic 12.3% |
| Europeans | 1.4 /100 | #251 | Tragic 12.3% |
| Bermudans | 1.1 /100 | #252 | Tragic 12.3% |
| Belgians | 0.8 /100 | #253 | Tragic 12.3% |
| German Russians | 0.8 /100 | #254 | Tragic 12.3% |
| Slovenes | 0.6 /100 | #255 | Tragic 12.4% |
| Immigrants | Dominica | 0.6 /100 | #256 | Tragic 12.4% |
| Immigrants | Laos | 0.5 /100 | #257 | Tragic 12.4% |
| Slavs | 0.5 /100 | #258 | Tragic 12.4% |
| Canadians | 0.4 /100 | #259 | Tragic 12.4% |
| Immigrants | Liberia | 0.4 /100 | #260 | Tragic 12.4% |