Immigrants from Belarus vs Bangladeshi Vision Disability
COMPARE
Immigrants from Belarus
Bangladeshi
Vision Disability
Vision Disability Comparison
Immigrants from Belarus
Bangladeshis
2.0%
VISION DISABILITY
99.3/ 100
METRIC RATING
53rd/ 347
METRIC RANK
2.3%
VISION DISABILITY
0.5/ 100
METRIC RATING
250th/ 347
METRIC RANK
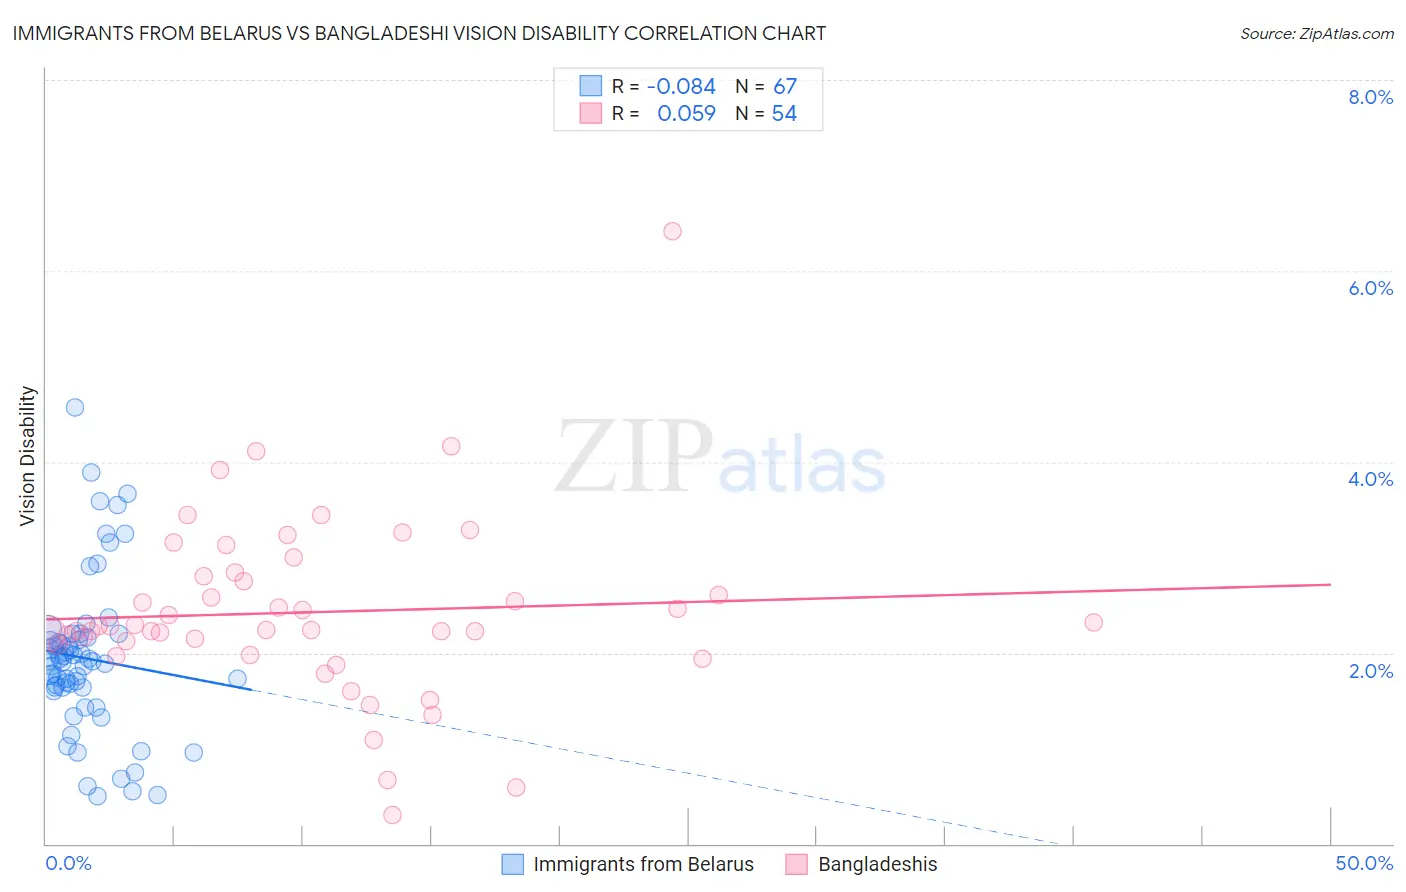
Immigrants from Belarus vs Bangladeshi Vision Disability Correlation Chart
The statistical analysis conducted on geographies consisting of 150,159,443 people shows a slight negative correlation between the proportion of Immigrants from Belarus and percentage of population with vision disability in the United States with a correlation coefficient (R) of -0.084 and weighted average of 2.0%. Similarly, the statistical analysis conducted on geographies consisting of 141,342,048 people shows a slight positive correlation between the proportion of Bangladeshis and percentage of population with vision disability in the United States with a correlation coefficient (R) of 0.059 and weighted average of 2.3%, a difference of 17.8%.
Vision Disability Correlation Summary
| Measurement | Immigrants from Belarus | Bangladeshi |
| Minimum | 0.50% | 0.30% |
| Maximum | 4.6% | 6.4% |
| Range | 4.1% | 6.1% |
| Mean | 1.9% | 2.4% |
| Median | 1.9% | 2.3% |
| Interquartile 25% (IQ1) | 1.6% | 2.1% |
| Interquartile 75% (IQ3) | 2.2% | 2.8% |
| Interquartile Range (IQR) | 0.52% | 0.72% |
| Standard Deviation (Sample) | 0.82% | 0.96% |
| Standard Deviation (Population) | 0.81% | 0.95% |
Similar Demographics by Vision Disability
Demographics Similar to Immigrants from Belarus by Vision Disability
In terms of vision disability, the demographic groups most similar to Immigrants from Belarus are Macedonian (2.0%, a difference of 0.040%), Laotian (2.0%, a difference of 0.090%), Immigrants from Serbia (2.0%, a difference of 0.11%), Jordanian (2.0%, a difference of 0.26%), and Somali (2.0%, a difference of 0.28%).
| Demographics | Rating | Rank | Vision Disability |
| Immigrants | Sweden | 99.7 /100 | #46 | Exceptional 2.0% |
| Immigrants | Bulgaria | 99.7 /100 | #47 | Exceptional 2.0% |
| Israelis | 99.6 /100 | #48 | Exceptional 2.0% |
| Latvians | 99.5 /100 | #49 | Exceptional 2.0% |
| Afghans | 99.5 /100 | #50 | Exceptional 2.0% |
| Tongans | 99.5 /100 | #51 | Exceptional 2.0% |
| Immigrants | Serbia | 99.4 /100 | #52 | Exceptional 2.0% |
| Immigrants | Belarus | 99.3 /100 | #53 | Exceptional 2.0% |
| Macedonians | 99.3 /100 | #54 | Exceptional 2.0% |
| Laotians | 99.3 /100 | #55 | Exceptional 2.0% |
| Jordanians | 99.2 /100 | #56 | Exceptional 2.0% |
| Somalis | 99.2 /100 | #57 | Exceptional 2.0% |
| Immigrants | Saudi Arabia | 99.2 /100 | #58 | Exceptional 2.0% |
| Argentineans | 99.1 /100 | #59 | Exceptional 2.0% |
| Immigrants | Romania | 99.1 /100 | #60 | Exceptional 2.0% |
Demographics Similar to Bangladeshis by Vision Disability
In terms of vision disability, the demographic groups most similar to Bangladeshis are Liberian (2.3%, a difference of 0.080%), Subsaharan African (2.3%, a difference of 0.10%), Immigrants from Laos (2.4%, a difference of 0.11%), Guatemalan (2.3%, a difference of 0.12%), and French (2.3%, a difference of 0.15%).
| Demographics | Rating | Rank | Vision Disability |
| Immigrants | Nicaragua | 0.6 /100 | #243 | Tragic 2.3% |
| Immigrants | West Indies | 0.6 /100 | #244 | Tragic 2.3% |
| Alsatians | 0.6 /100 | #245 | Tragic 2.3% |
| French | 0.5 /100 | #246 | Tragic 2.3% |
| Guatemalans | 0.5 /100 | #247 | Tragic 2.3% |
| Sub-Saharan Africans | 0.5 /100 | #248 | Tragic 2.3% |
| Liberians | 0.5 /100 | #249 | Tragic 2.3% |
| Bangladeshis | 0.5 /100 | #250 | Tragic 2.3% |
| Immigrants | Laos | 0.4 /100 | #251 | Tragic 2.4% |
| Immigrants | Micronesia | 0.3 /100 | #252 | Tragic 2.4% |
| Japanese | 0.3 /100 | #253 | Tragic 2.4% |
| Haitians | 0.3 /100 | #254 | Tragic 2.4% |
| Immigrants | Guatemala | 0.3 /100 | #255 | Tragic 2.4% |
| Immigrants | Haiti | 0.2 /100 | #256 | Tragic 2.4% |
| West Indians | 0.2 /100 | #257 | Tragic 2.4% |