Paraguayan vs Shoshone Hearing Disability
COMPARE
Paraguayan
Shoshone
Hearing Disability
Hearing Disability Comparison
Paraguayans
Shoshone
2.7%
HEARING DISABILITY
99.2/ 100
METRIC RATING
50th/ 347
METRIC RANK
4.0%
HEARING DISABILITY
0.0/ 100
METRIC RATING
320th/ 347
METRIC RANK
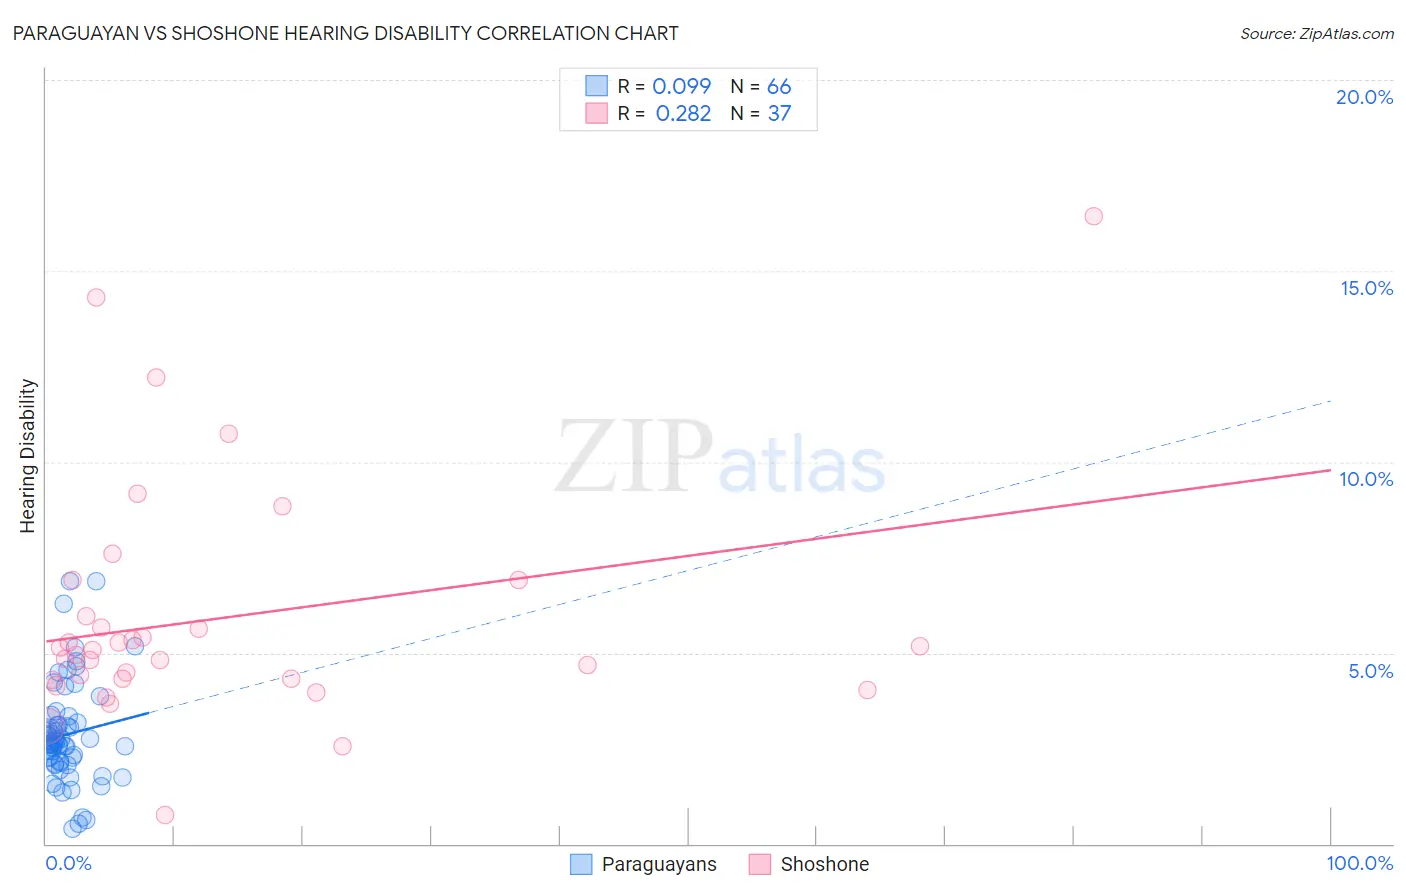
Paraguayan vs Shoshone Hearing Disability Correlation Chart
The statistical analysis conducted on geographies consisting of 95,101,593 people shows a slight positive correlation between the proportion of Paraguayans and percentage of population with hearing disability in the United States with a correlation coefficient (R) of 0.099 and weighted average of 2.7%. Similarly, the statistical analysis conducted on geographies consisting of 66,619,523 people shows a weak positive correlation between the proportion of Shoshone and percentage of population with hearing disability in the United States with a correlation coefficient (R) of 0.282 and weighted average of 4.0%, a difference of 51.5%.
Hearing Disability Correlation Summary
| Measurement | Paraguayan | Shoshone |
| Minimum | 0.40% | 0.77% |
| Maximum | 6.9% | 16.4% |
| Range | 6.5% | 15.7% |
| Mean | 2.9% | 5.9% |
| Median | 2.6% | 5.1% |
| Interquartile 25% (IQ1) | 2.1% | 4.3% |
| Interquartile 75% (IQ3) | 3.2% | 6.4% |
| Interquartile Range (IQR) | 1.0% | 2.1% |
| Standard Deviation (Sample) | 1.3% | 3.1% |
| Standard Deviation (Population) | 1.3% | 3.1% |
Similar Demographics by Hearing Disability
Demographics Similar to Paraguayans by Hearing Disability
In terms of hearing disability, the demographic groups most similar to Paraguayans are Immigrants from Hong Kong (2.7%, a difference of 0.070%), Immigrants from South America (2.7%, a difference of 0.19%), Immigrants from Singapore (2.6%, a difference of 0.31%), Immigrants from Israel (2.6%, a difference of 0.38%), and Jamaican (2.7%, a difference of 0.42%).
| Demographics | Rating | Rank | Hearing Disability |
| Senegalese | 99.4 /100 | #43 | Exceptional 2.6% |
| Nigerians | 99.4 /100 | #44 | Exceptional 2.6% |
| Venezuelans | 99.4 /100 | #45 | Exceptional 2.6% |
| Immigrants | Dominica | 99.3 /100 | #46 | Exceptional 2.6% |
| Immigrants | Israel | 99.3 /100 | #47 | Exceptional 2.6% |
| Immigrants | Singapore | 99.3 /100 | #48 | Exceptional 2.6% |
| Immigrants | South America | 99.2 /100 | #49 | Exceptional 2.7% |
| Paraguayans | 99.2 /100 | #50 | Exceptional 2.7% |
| Immigrants | Hong Kong | 99.2 /100 | #51 | Exceptional 2.7% |
| Jamaicans | 99.0 /100 | #52 | Exceptional 2.7% |
| Immigrants | Eastern Asia | 99.0 /100 | #53 | Exceptional 2.7% |
| Ethiopians | 99.0 /100 | #54 | Exceptional 2.7% |
| Immigrants | Ethiopia | 99.0 /100 | #55 | Exceptional 2.7% |
| Immigrants | Nicaragua | 99.0 /100 | #56 | Exceptional 2.7% |
| South Americans | 99.0 /100 | #57 | Exceptional 2.7% |
Demographics Similar to Shoshone by Hearing Disability
In terms of hearing disability, the demographic groups most similar to Shoshone are Chippewa (4.0%, a difference of 0.81%), Paiute (4.1%, a difference of 1.2%), Cheyenne (4.0%, a difference of 1.5%), Seminole (4.1%, a difference of 1.5%), and Comanche (4.0%, a difference of 1.6%).
| Demographics | Rating | Rank | Hearing Disability |
| Hopi | 0.0 /100 | #313 | Tragic 3.9% |
| Yakama | 0.0 /100 | #314 | Tragic 3.9% |
| Puget Sound Salish | 0.0 /100 | #315 | Tragic 3.9% |
| Spanish Americans | 0.0 /100 | #316 | Tragic 4.0% |
| Comanche | 0.0 /100 | #317 | Tragic 4.0% |
| Cheyenne | 0.0 /100 | #318 | Tragic 4.0% |
| Chippewa | 0.0 /100 | #319 | Tragic 4.0% |
| Shoshone | 0.0 /100 | #320 | Tragic 4.0% |
| Paiute | 0.0 /100 | #321 | Tragic 4.1% |
| Seminole | 0.0 /100 | #322 | Tragic 4.1% |
| Apache | 0.0 /100 | #323 | Tragic 4.1% |
| Osage | 0.0 /100 | #324 | Tragic 4.1% |
| Lumbee | 0.0 /100 | #325 | Tragic 4.1% |
| Potawatomi | 0.0 /100 | #326 | Tragic 4.1% |
| Arapaho | 0.0 /100 | #327 | Tragic 4.1% |