Paraguayan vs Pakistani Hearing Disability
COMPARE
Paraguayan
Pakistani
Hearing Disability
Hearing Disability Comparison
Paraguayans
Pakistanis
2.7%
HEARING DISABILITY
99.2/ 100
METRIC RATING
50th/ 347
METRIC RANK
3.1%
HEARING DISABILITY
11.1/ 100
METRIC RATING
212th/ 347
METRIC RANK
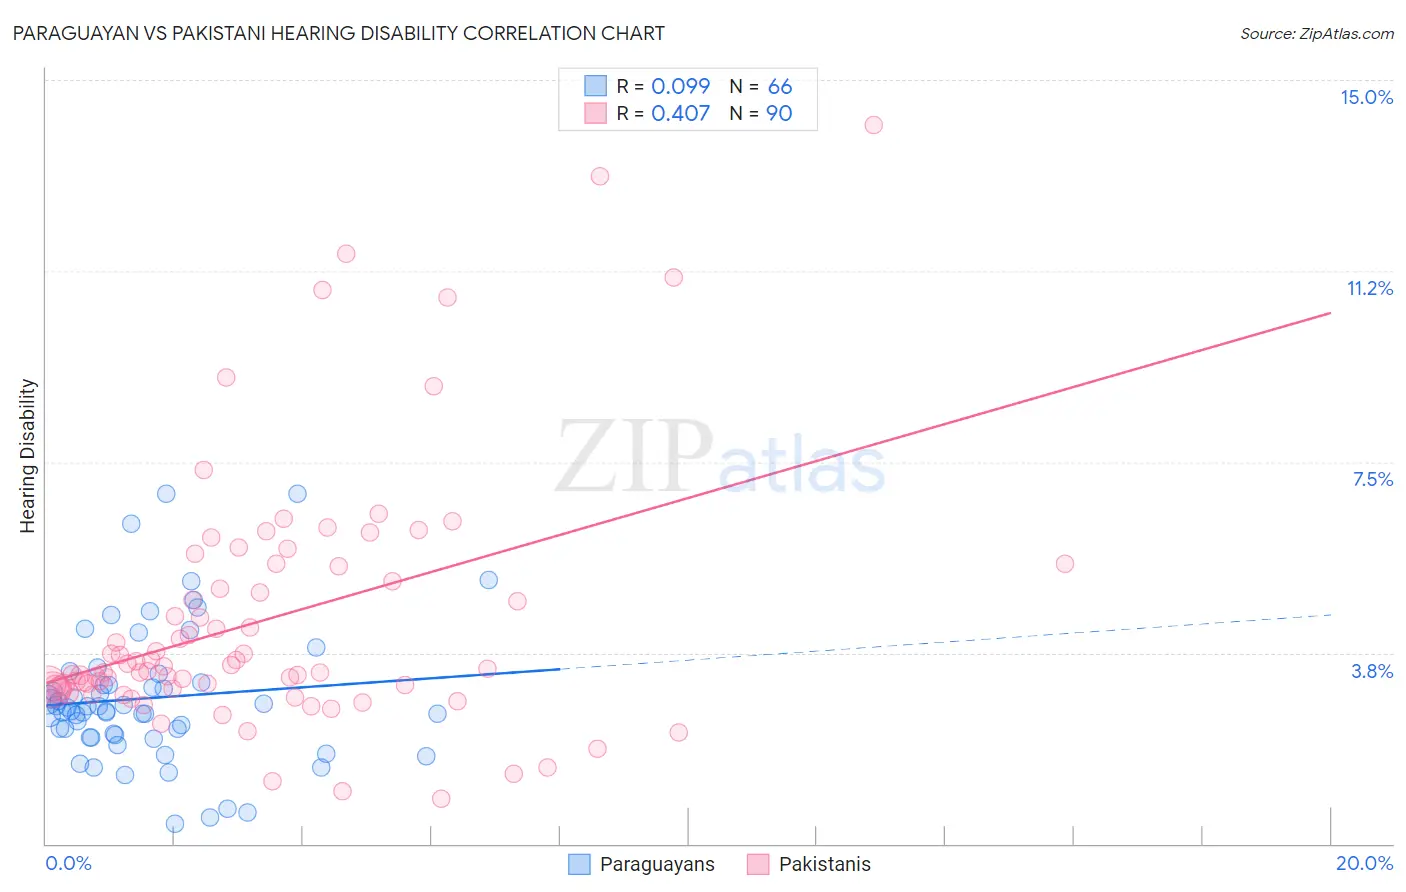
Paraguayan vs Pakistani Hearing Disability Correlation Chart
The statistical analysis conducted on geographies consisting of 95,101,593 people shows a slight positive correlation between the proportion of Paraguayans and percentage of population with hearing disability in the United States with a correlation coefficient (R) of 0.099 and weighted average of 2.7%. Similarly, the statistical analysis conducted on geographies consisting of 335,217,185 people shows a moderate positive correlation between the proportion of Pakistanis and percentage of population with hearing disability in the United States with a correlation coefficient (R) of 0.407 and weighted average of 3.1%, a difference of 18.2%.
Hearing Disability Correlation Summary
| Measurement | Paraguayan | Pakistani |
| Minimum | 0.40% | 0.88% |
| Maximum | 6.9% | 14.1% |
| Range | 6.5% | 13.2% |
| Mean | 2.9% | 4.4% |
| Median | 2.6% | 3.5% |
| Interquartile 25% (IQ1) | 2.1% | 3.0% |
| Interquartile 75% (IQ3) | 3.2% | 5.4% |
| Interquartile Range (IQR) | 1.0% | 2.4% |
| Standard Deviation (Sample) | 1.3% | 2.6% |
| Standard Deviation (Population) | 1.3% | 2.5% |
Similar Demographics by Hearing Disability
Demographics Similar to Paraguayans by Hearing Disability
In terms of hearing disability, the demographic groups most similar to Paraguayans are Immigrants from Hong Kong (2.7%, a difference of 0.070%), Immigrants from South America (2.7%, a difference of 0.19%), Immigrants from Singapore (2.6%, a difference of 0.31%), Immigrants from Israel (2.6%, a difference of 0.38%), and Jamaican (2.7%, a difference of 0.42%).
| Demographics | Rating | Rank | Hearing Disability |
| Senegalese | 99.4 /100 | #43 | Exceptional 2.6% |
| Nigerians | 99.4 /100 | #44 | Exceptional 2.6% |
| Venezuelans | 99.4 /100 | #45 | Exceptional 2.6% |
| Immigrants | Dominica | 99.3 /100 | #46 | Exceptional 2.6% |
| Immigrants | Israel | 99.3 /100 | #47 | Exceptional 2.6% |
| Immigrants | Singapore | 99.3 /100 | #48 | Exceptional 2.6% |
| Immigrants | South America | 99.2 /100 | #49 | Exceptional 2.7% |
| Paraguayans | 99.2 /100 | #50 | Exceptional 2.7% |
| Immigrants | Hong Kong | 99.2 /100 | #51 | Exceptional 2.7% |
| Jamaicans | 99.0 /100 | #52 | Exceptional 2.7% |
| Immigrants | Eastern Asia | 99.0 /100 | #53 | Exceptional 2.7% |
| Ethiopians | 99.0 /100 | #54 | Exceptional 2.7% |
| Immigrants | Ethiopia | 99.0 /100 | #55 | Exceptional 2.7% |
| Immigrants | Nicaragua | 99.0 /100 | #56 | Exceptional 2.7% |
| South Americans | 99.0 /100 | #57 | Exceptional 2.7% |
Demographics Similar to Pakistanis by Hearing Disability
In terms of hearing disability, the demographic groups most similar to Pakistanis are Immigrants from Iraq (3.1%, a difference of 0.15%), Romanian (3.1%, a difference of 0.21%), Cape Verdean (3.1%, a difference of 0.25%), Immigrants from Hungary (3.1%, a difference of 0.29%), and Immigrants from Latvia (3.1%, a difference of 0.33%).
| Demographics | Rating | Rank | Hearing Disability |
| Alsatians | 15.9 /100 | #205 | Poor 3.1% |
| Eastern Europeans | 15.5 /100 | #206 | Poor 3.1% |
| Hispanics or Latinos | 15.1 /100 | #207 | Poor 3.1% |
| Immigrants | Latvia | 12.7 /100 | #208 | Poor 3.1% |
| Immigrants | Hungary | 12.5 /100 | #209 | Poor 3.1% |
| Cape Verdeans | 12.2 /100 | #210 | Poor 3.1% |
| Romanians | 12.1 /100 | #211 | Poor 3.1% |
| Pakistanis | 11.1 /100 | #212 | Poor 3.1% |
| Immigrants | Iraq | 10.5 /100 | #213 | Poor 3.1% |
| Australians | 8.1 /100 | #214 | Tragic 3.2% |
| Bangladeshis | 8.1 /100 | #215 | Tragic 3.2% |
| Immigrants | Norway | 7.3 /100 | #216 | Tragic 3.2% |
| Russians | 7.1 /100 | #217 | Tragic 3.2% |
| Immigrants | Northern Europe | 7.0 /100 | #218 | Tragic 3.2% |
| New Zealanders | 6.8 /100 | #219 | Tragic 3.2% |