Immigrants from South America vs Shoshone Hearing Disability
COMPARE
Immigrants from South America
Shoshone
Hearing Disability
Hearing Disability Comparison
Immigrants from South America
Shoshone
2.7%
HEARING DISABILITY
99.2/ 100
METRIC RATING
49th/ 347
METRIC RANK
4.0%
HEARING DISABILITY
0.0/ 100
METRIC RATING
320th/ 347
METRIC RANK
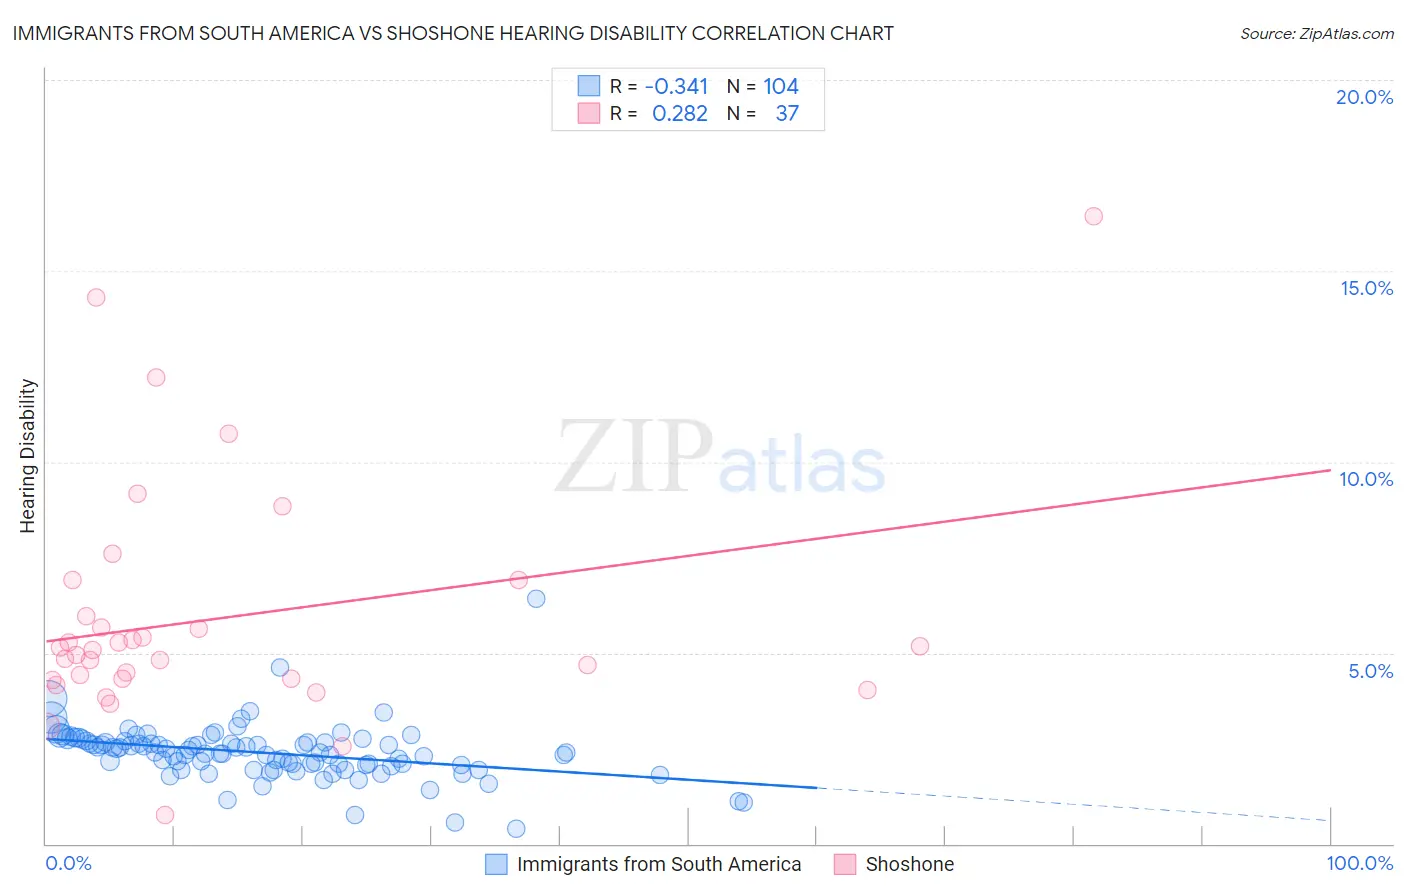
Immigrants from South America vs Shoshone Hearing Disability Correlation Chart
The statistical analysis conducted on geographies consisting of 486,101,818 people shows a mild negative correlation between the proportion of Immigrants from South America and percentage of population with hearing disability in the United States with a correlation coefficient (R) of -0.341 and weighted average of 2.7%. Similarly, the statistical analysis conducted on geographies consisting of 66,619,523 people shows a weak positive correlation between the proportion of Shoshone and percentage of population with hearing disability in the United States with a correlation coefficient (R) of 0.282 and weighted average of 4.0%, a difference of 51.7%.
Hearing Disability Correlation Summary
| Measurement | Immigrants from South America | Shoshone |
| Minimum | 0.40% | 0.77% |
| Maximum | 6.4% | 16.4% |
| Range | 6.0% | 15.7% |
| Mean | 2.4% | 5.9% |
| Median | 2.4% | 5.1% |
| Interquartile 25% (IQ1) | 2.1% | 4.3% |
| Interquartile 75% (IQ3) | 2.7% | 6.4% |
| Interquartile Range (IQR) | 0.61% | 2.1% |
| Standard Deviation (Sample) | 0.73% | 3.1% |
| Standard Deviation (Population) | 0.73% | 3.1% |
Similar Demographics by Hearing Disability
Demographics Similar to Immigrants from South America by Hearing Disability
In terms of hearing disability, the demographic groups most similar to Immigrants from South America are Immigrants from Singapore (2.6%, a difference of 0.12%), Immigrants from Israel (2.6%, a difference of 0.19%), Paraguayan (2.7%, a difference of 0.19%), Immigrants from Hong Kong (2.7%, a difference of 0.26%), and Immigrants from Dominica (2.6%, a difference of 0.34%).
| Demographics | Rating | Rank | Hearing Disability |
| West Indians | 99.4 /100 | #42 | Exceptional 2.6% |
| Senegalese | 99.4 /100 | #43 | Exceptional 2.6% |
| Nigerians | 99.4 /100 | #44 | Exceptional 2.6% |
| Venezuelans | 99.4 /100 | #45 | Exceptional 2.6% |
| Immigrants | Dominica | 99.3 /100 | #46 | Exceptional 2.6% |
| Immigrants | Israel | 99.3 /100 | #47 | Exceptional 2.6% |
| Immigrants | Singapore | 99.3 /100 | #48 | Exceptional 2.6% |
| Immigrants | South America | 99.2 /100 | #49 | Exceptional 2.7% |
| Paraguayans | 99.2 /100 | #50 | Exceptional 2.7% |
| Immigrants | Hong Kong | 99.2 /100 | #51 | Exceptional 2.7% |
| Jamaicans | 99.0 /100 | #52 | Exceptional 2.7% |
| Immigrants | Eastern Asia | 99.0 /100 | #53 | Exceptional 2.7% |
| Ethiopians | 99.0 /100 | #54 | Exceptional 2.7% |
| Immigrants | Ethiopia | 99.0 /100 | #55 | Exceptional 2.7% |
| Immigrants | Nicaragua | 99.0 /100 | #56 | Exceptional 2.7% |
Demographics Similar to Shoshone by Hearing Disability
In terms of hearing disability, the demographic groups most similar to Shoshone are Chippewa (4.0%, a difference of 0.81%), Paiute (4.1%, a difference of 1.2%), Cheyenne (4.0%, a difference of 1.5%), Seminole (4.1%, a difference of 1.5%), and Comanche (4.0%, a difference of 1.6%).
| Demographics | Rating | Rank | Hearing Disability |
| Hopi | 0.0 /100 | #313 | Tragic 3.9% |
| Yakama | 0.0 /100 | #314 | Tragic 3.9% |
| Puget Sound Salish | 0.0 /100 | #315 | Tragic 3.9% |
| Spanish Americans | 0.0 /100 | #316 | Tragic 4.0% |
| Comanche | 0.0 /100 | #317 | Tragic 4.0% |
| Cheyenne | 0.0 /100 | #318 | Tragic 4.0% |
| Chippewa | 0.0 /100 | #319 | Tragic 4.0% |
| Shoshone | 0.0 /100 | #320 | Tragic 4.0% |
| Paiute | 0.0 /100 | #321 | Tragic 4.1% |
| Seminole | 0.0 /100 | #322 | Tragic 4.1% |
| Apache | 0.0 /100 | #323 | Tragic 4.1% |
| Osage | 0.0 /100 | #324 | Tragic 4.1% |
| Lumbee | 0.0 /100 | #325 | Tragic 4.1% |
| Potawatomi | 0.0 /100 | #326 | Tragic 4.1% |
| Arapaho | 0.0 /100 | #327 | Tragic 4.1% |