Immigrants from Austria vs Shoshone Hearing Disability
COMPARE
Immigrants from Austria
Shoshone
Hearing Disability
Hearing Disability Comparison
Immigrants from Austria
Shoshone
3.3%
HEARING DISABILITY
1.8/ 100
METRIC RATING
237th/ 347
METRIC RANK
4.0%
HEARING DISABILITY
0.0/ 100
METRIC RATING
320th/ 347
METRIC RANK
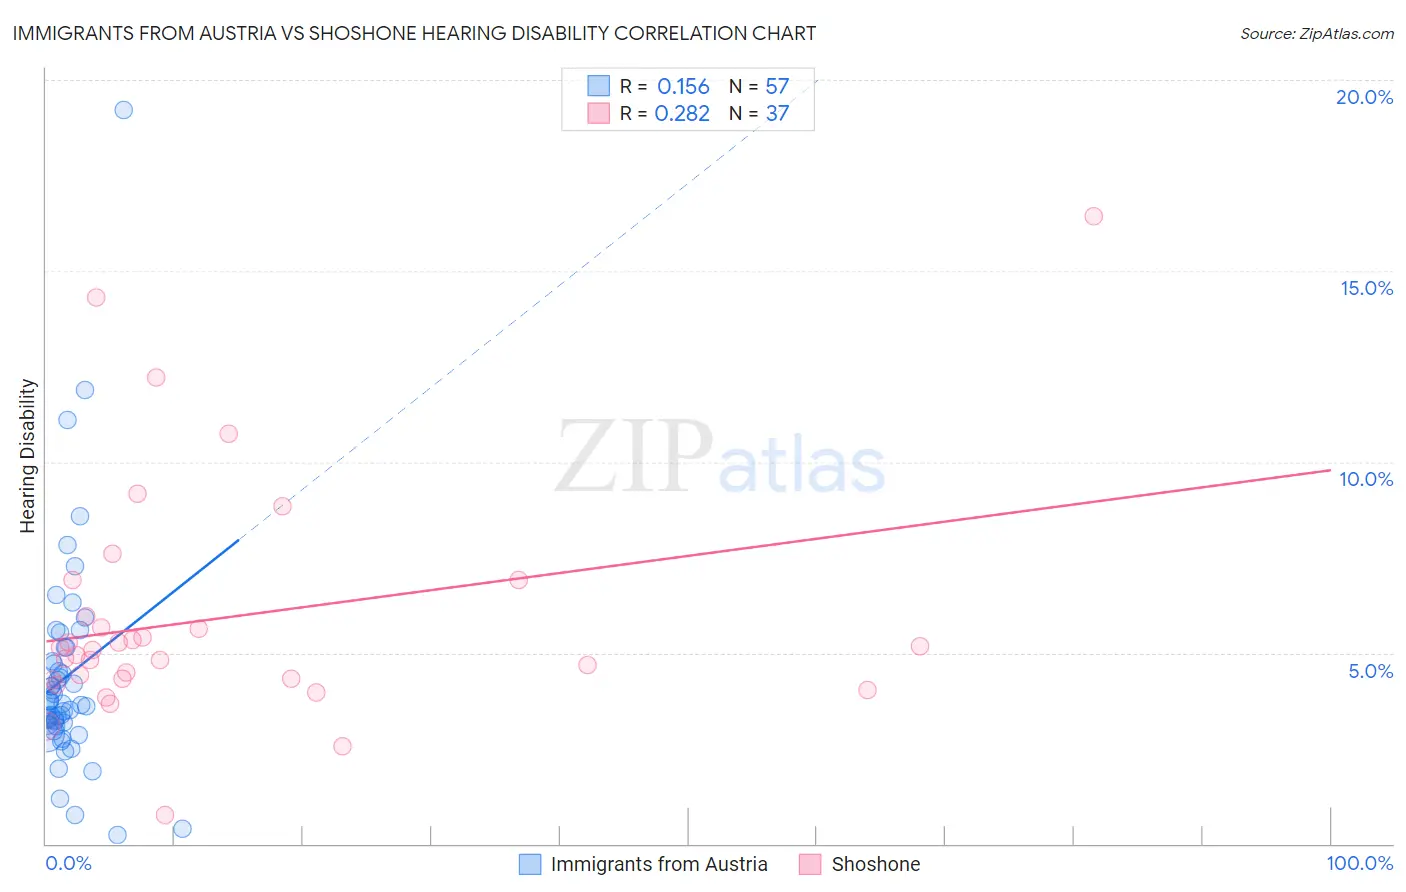
Immigrants from Austria vs Shoshone Hearing Disability Correlation Chart
The statistical analysis conducted on geographies consisting of 167,968,666 people shows a poor positive correlation between the proportion of Immigrants from Austria and percentage of population with hearing disability in the United States with a correlation coefficient (R) of 0.156 and weighted average of 3.3%. Similarly, the statistical analysis conducted on geographies consisting of 66,619,523 people shows a weak positive correlation between the proportion of Shoshone and percentage of population with hearing disability in the United States with a correlation coefficient (R) of 0.282 and weighted average of 4.0%, a difference of 22.9%.
Hearing Disability Correlation Summary
| Measurement | Immigrants from Austria | Shoshone |
| Minimum | 0.21% | 0.77% |
| Maximum | 19.2% | 16.4% |
| Range | 19.0% | 15.7% |
| Mean | 4.4% | 5.9% |
| Median | 3.7% | 5.1% |
| Interquartile 25% (IQ1) | 3.1% | 4.3% |
| Interquartile 75% (IQ3) | 5.0% | 6.4% |
| Interquartile Range (IQR) | 1.9% | 2.1% |
| Standard Deviation (Sample) | 2.9% | 3.1% |
| Standard Deviation (Population) | 2.9% | 3.1% |
Similar Demographics by Hearing Disability
Demographics Similar to Immigrants from Austria by Hearing Disability
In terms of hearing disability, the demographic groups most similar to Immigrants from Austria are German Russian (3.3%, a difference of 0.0%), Serbian (3.3%, a difference of 0.39%), Guamanian/Chamorro (3.3%, a difference of 0.46%), Central American Indian (3.3%, a difference of 0.56%), and Estonian (3.3%, a difference of 0.63%).
| Demographics | Rating | Rank | Hearing Disability |
| Greeks | 3.2 /100 | #230 | Tragic 3.2% |
| Luxembourgers | 2.9 /100 | #231 | Tragic 3.2% |
| Ukrainians | 2.9 /100 | #232 | Tragic 3.2% |
| Estonians | 2.4 /100 | #233 | Tragic 3.3% |
| Central American Indians | 2.3 /100 | #234 | Tragic 3.3% |
| Guamanians/Chamorros | 2.2 /100 | #235 | Tragic 3.3% |
| Serbians | 2.2 /100 | #236 | Tragic 3.3% |
| Immigrants | Austria | 1.8 /100 | #237 | Tragic 3.3% |
| German Russians | 1.8 /100 | #238 | Tragic 3.3% |
| Nepalese | 1.2 /100 | #239 | Tragic 3.3% |
| Immigrants | Netherlands | 1.1 /100 | #240 | Tragic 3.3% |
| Samoans | 1.1 /100 | #241 | Tragic 3.3% |
| Yugoslavians | 1.0 /100 | #242 | Tragic 3.3% |
| Immigrants | Western Europe | 1.0 /100 | #243 | Tragic 3.3% |
| Assyrians/Chaldeans/Syriacs | 0.9 /100 | #244 | Tragic 3.3% |
Demographics Similar to Shoshone by Hearing Disability
In terms of hearing disability, the demographic groups most similar to Shoshone are Chippewa (4.0%, a difference of 0.81%), Paiute (4.1%, a difference of 1.2%), Cheyenne (4.0%, a difference of 1.5%), Seminole (4.1%, a difference of 1.5%), and Comanche (4.0%, a difference of 1.6%).
| Demographics | Rating | Rank | Hearing Disability |
| Hopi | 0.0 /100 | #313 | Tragic 3.9% |
| Yakama | 0.0 /100 | #314 | Tragic 3.9% |
| Puget Sound Salish | 0.0 /100 | #315 | Tragic 3.9% |
| Spanish Americans | 0.0 /100 | #316 | Tragic 4.0% |
| Comanche | 0.0 /100 | #317 | Tragic 4.0% |
| Cheyenne | 0.0 /100 | #318 | Tragic 4.0% |
| Chippewa | 0.0 /100 | #319 | Tragic 4.0% |
| Shoshone | 0.0 /100 | #320 | Tragic 4.0% |
| Paiute | 0.0 /100 | #321 | Tragic 4.1% |
| Seminole | 0.0 /100 | #322 | Tragic 4.1% |
| Apache | 0.0 /100 | #323 | Tragic 4.1% |
| Osage | 0.0 /100 | #324 | Tragic 4.1% |
| Lumbee | 0.0 /100 | #325 | Tragic 4.1% |
| Potawatomi | 0.0 /100 | #326 | Tragic 4.1% |
| Arapaho | 0.0 /100 | #327 | Tragic 4.1% |