Paraguayan vs Immigrants from Guyana Hearing Disability
COMPARE
Paraguayan
Immigrants from Guyana
Hearing Disability
Hearing Disability Comparison
Paraguayans
Immigrants from Guyana
2.7%
HEARING DISABILITY
99.2/ 100
METRIC RATING
50th/ 347
METRIC RANK
2.3%
HEARING DISABILITY
100.0/ 100
METRIC RATING
4th/ 347
METRIC RANK
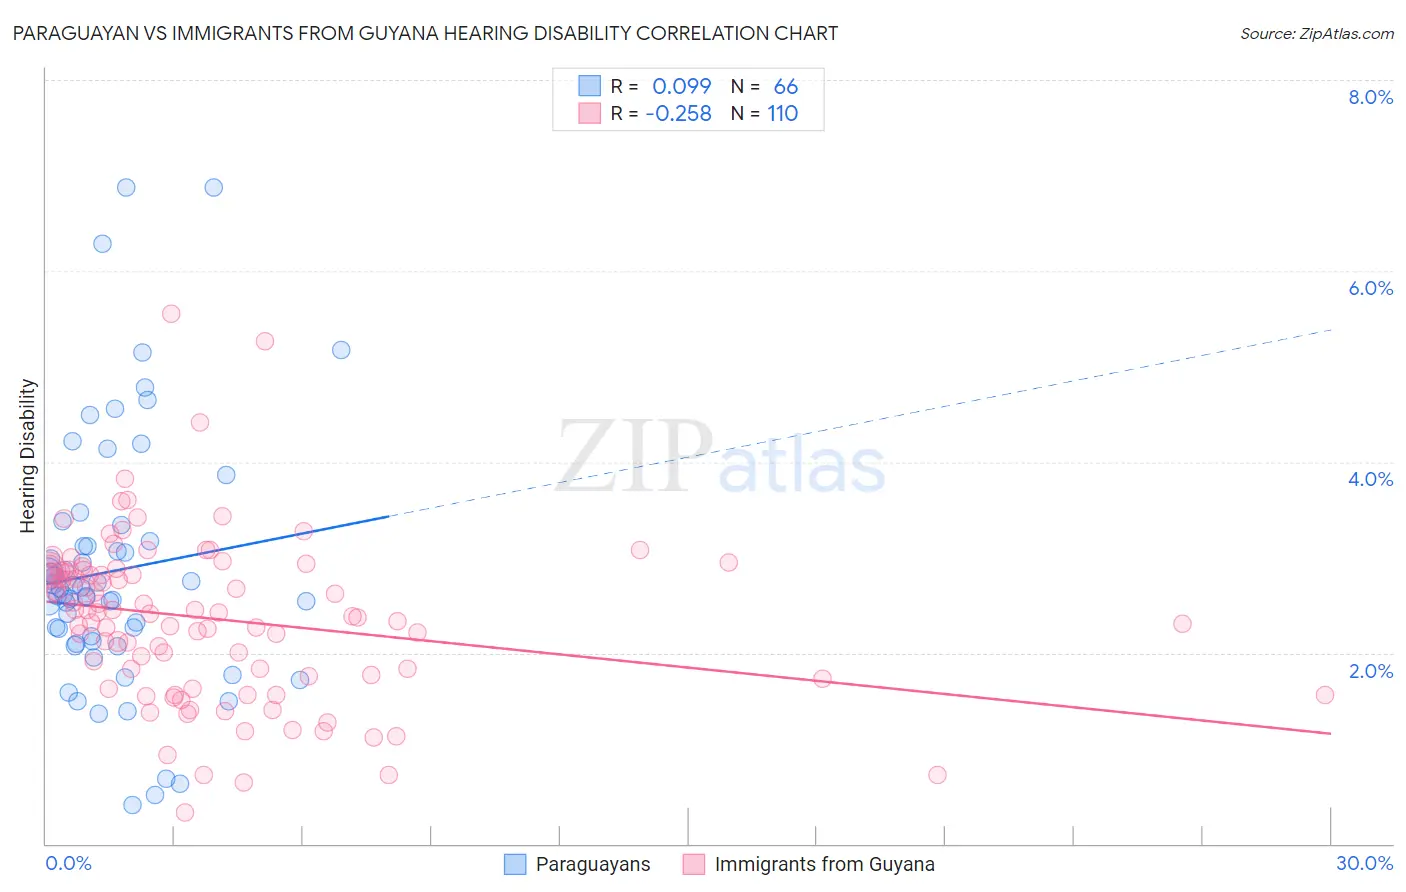
Paraguayan vs Immigrants from Guyana Hearing Disability Correlation Chart
The statistical analysis conducted on geographies consisting of 95,101,593 people shows a slight positive correlation between the proportion of Paraguayans and percentage of population with hearing disability in the United States with a correlation coefficient (R) of 0.099 and weighted average of 2.7%. Similarly, the statistical analysis conducted on geographies consisting of 183,657,050 people shows a weak negative correlation between the proportion of Immigrants from Guyana and percentage of population with hearing disability in the United States with a correlation coefficient (R) of -0.258 and weighted average of 2.3%, a difference of 14.7%.
Hearing Disability Correlation Summary
| Measurement | Paraguayan | Immigrants from Guyana |
| Minimum | 0.40% | 0.33% |
| Maximum | 6.9% | 5.6% |
| Range | 6.5% | 5.2% |
| Mean | 2.9% | 2.4% |
| Median | 2.6% | 2.4% |
| Interquartile 25% (IQ1) | 2.1% | 1.8% |
| Interquartile 75% (IQ3) | 3.2% | 2.9% |
| Interquartile Range (IQR) | 1.0% | 1.1% |
| Standard Deviation (Sample) | 1.3% | 0.87% |
| Standard Deviation (Population) | 1.3% | 0.86% |
Similar Demographics by Hearing Disability
Demographics Similar to Paraguayans by Hearing Disability
In terms of hearing disability, the demographic groups most similar to Paraguayans are Immigrants from Hong Kong (2.7%, a difference of 0.070%), Immigrants from South America (2.7%, a difference of 0.19%), Immigrants from Singapore (2.6%, a difference of 0.31%), Immigrants from Israel (2.6%, a difference of 0.38%), and Jamaican (2.7%, a difference of 0.42%).
| Demographics | Rating | Rank | Hearing Disability |
| Senegalese | 99.4 /100 | #43 | Exceptional 2.6% |
| Nigerians | 99.4 /100 | #44 | Exceptional 2.6% |
| Venezuelans | 99.4 /100 | #45 | Exceptional 2.6% |
| Immigrants | Dominica | 99.3 /100 | #46 | Exceptional 2.6% |
| Immigrants | Israel | 99.3 /100 | #47 | Exceptional 2.6% |
| Immigrants | Singapore | 99.3 /100 | #48 | Exceptional 2.6% |
| Immigrants | South America | 99.2 /100 | #49 | Exceptional 2.7% |
| Paraguayans | 99.2 /100 | #50 | Exceptional 2.7% |
| Immigrants | Hong Kong | 99.2 /100 | #51 | Exceptional 2.7% |
| Jamaicans | 99.0 /100 | #52 | Exceptional 2.7% |
| Immigrants | Eastern Asia | 99.0 /100 | #53 | Exceptional 2.7% |
| Ethiopians | 99.0 /100 | #54 | Exceptional 2.7% |
| Immigrants | Ethiopia | 99.0 /100 | #55 | Exceptional 2.7% |
| Immigrants | Nicaragua | 99.0 /100 | #56 | Exceptional 2.7% |
| South Americans | 99.0 /100 | #57 | Exceptional 2.7% |
Demographics Similar to Immigrants from Guyana by Hearing Disability
In terms of hearing disability, the demographic groups most similar to Immigrants from Guyana are Guyanese (2.3%, a difference of 1.4%), Immigrants from Barbados (2.4%, a difference of 1.9%), Immigrants from St. Vincent and the Grenadines (2.3%, a difference of 2.8%), Vietnamese (2.4%, a difference of 3.0%), and Immigrants from Bangladesh (2.4%, a difference of 4.6%).
| Demographics | Rating | Rank | Hearing Disability |
| Immigrants | Grenada | 100.0 /100 | #1 | Exceptional 2.2% |
| Immigrants | St. Vincent and the Grenadines | 100.0 /100 | #2 | Exceptional 2.3% |
| Guyanese | 100.0 /100 | #3 | Exceptional 2.3% |
| Immigrants | Guyana | 100.0 /100 | #4 | Exceptional 2.3% |
| Immigrants | Barbados | 100.0 /100 | #5 | Exceptional 2.4% |
| Vietnamese | 100.0 /100 | #6 | Exceptional 2.4% |
| Immigrants | Bangladesh | 100.0 /100 | #7 | Exceptional 2.4% |
| British West Indians | 100.0 /100 | #8 | Exceptional 2.4% |
| Immigrants | Dominican Republic | 100.0 /100 | #9 | Exceptional 2.4% |
| Immigrants | Ecuador | 99.9 /100 | #10 | Exceptional 2.5% |
| Immigrants | Trinidad and Tobago | 99.9 /100 | #11 | Exceptional 2.5% |
| Trinidadians and Tobagonians | 99.9 /100 | #12 | Exceptional 2.5% |
| Sierra Leoneans | 99.9 /100 | #13 | Exceptional 2.5% |
| Ecuadorians | 99.9 /100 | #14 | Exceptional 2.5% |
| Barbadians | 99.9 /100 | #15 | Exceptional 2.5% |