Colombian vs Shoshone Hearing Disability
COMPARE
Colombian
Shoshone
Hearing Disability
Hearing Disability Comparison
Colombians
Shoshone
2.7%
HEARING DISABILITY
97.4/ 100
METRIC RATING
79th/ 347
METRIC RANK
4.0%
HEARING DISABILITY
0.0/ 100
METRIC RATING
320th/ 347
METRIC RANK
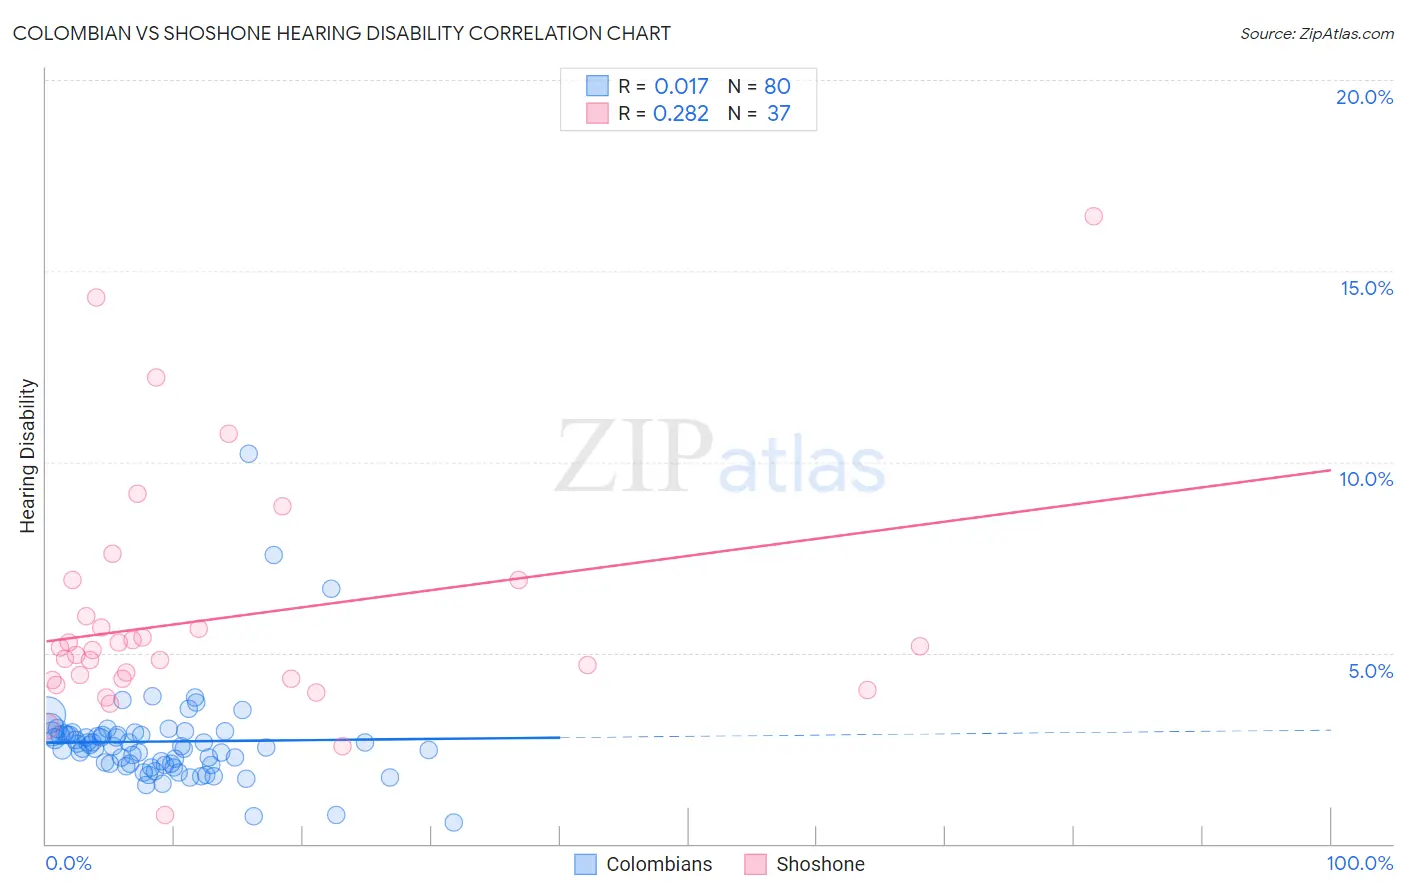
Colombian vs Shoshone Hearing Disability Correlation Chart
The statistical analysis conducted on geographies consisting of 419,423,725 people shows no correlation between the proportion of Colombians and percentage of population with hearing disability in the United States with a correlation coefficient (R) of 0.017 and weighted average of 2.7%. Similarly, the statistical analysis conducted on geographies consisting of 66,619,523 people shows a weak positive correlation between the proportion of Shoshone and percentage of population with hearing disability in the United States with a correlation coefficient (R) of 0.282 and weighted average of 4.0%, a difference of 46.9%.
Hearing Disability Correlation Summary
| Measurement | Colombian | Shoshone |
| Minimum | 0.57% | 0.77% |
| Maximum | 10.2% | 16.4% |
| Range | 9.7% | 15.7% |
| Mean | 2.7% | 5.9% |
| Median | 2.6% | 5.1% |
| Interquartile 25% (IQ1) | 2.1% | 4.3% |
| Interquartile 75% (IQ3) | 2.9% | 6.4% |
| Interquartile Range (IQR) | 0.79% | 2.1% |
| Standard Deviation (Sample) | 1.3% | 3.1% |
| Standard Deviation (Population) | 1.3% | 3.1% |
Similar Demographics by Hearing Disability
Demographics Similar to Colombians by Hearing Disability
In terms of hearing disability, the demographic groups most similar to Colombians are Mongolian (2.7%, a difference of 0.020%), Immigrants from Malaysia (2.7%, a difference of 0.060%), Asian (2.7%, a difference of 0.080%), Immigrants from Saudi Arabia (2.7%, a difference of 0.090%), and Immigrants from Korea (2.7%, a difference of 0.11%).
| Demographics | Rating | Rank | Hearing Disability |
| Afghans | 97.6 /100 | #72 | Exceptional 2.7% |
| Argentineans | 97.5 /100 | #73 | Exceptional 2.7% |
| Immigrants | Korea | 97.5 /100 | #74 | Exceptional 2.7% |
| Immigrants | Saudi Arabia | 97.5 /100 | #75 | Exceptional 2.7% |
| Asians | 97.5 /100 | #76 | Exceptional 2.7% |
| Immigrants | Malaysia | 97.5 /100 | #77 | Exceptional 2.7% |
| Mongolians | 97.4 /100 | #78 | Exceptional 2.7% |
| Colombians | 97.4 /100 | #79 | Exceptional 2.7% |
| Immigrants | Asia | 97.2 /100 | #80 | Exceptional 2.7% |
| Immigrants | Uruguay | 97.2 /100 | #81 | Exceptional 2.7% |
| Immigrants | Armenia | 97.2 /100 | #82 | Exceptional 2.7% |
| Immigrants | Cuba | 97.2 /100 | #83 | Exceptional 2.7% |
| Immigrants | Argentina | 97.0 /100 | #84 | Exceptional 2.8% |
| Immigrants | Northern Africa | 96.9 /100 | #85 | Exceptional 2.8% |
| Immigrants | Iran | 96.8 /100 | #86 | Exceptional 2.8% |
Demographics Similar to Shoshone by Hearing Disability
In terms of hearing disability, the demographic groups most similar to Shoshone are Chippewa (4.0%, a difference of 0.81%), Paiute (4.1%, a difference of 1.2%), Cheyenne (4.0%, a difference of 1.5%), Seminole (4.1%, a difference of 1.5%), and Comanche (4.0%, a difference of 1.6%).
| Demographics | Rating | Rank | Hearing Disability |
| Hopi | 0.0 /100 | #313 | Tragic 3.9% |
| Yakama | 0.0 /100 | #314 | Tragic 3.9% |
| Puget Sound Salish | 0.0 /100 | #315 | Tragic 3.9% |
| Spanish Americans | 0.0 /100 | #316 | Tragic 4.0% |
| Comanche | 0.0 /100 | #317 | Tragic 4.0% |
| Cheyenne | 0.0 /100 | #318 | Tragic 4.0% |
| Chippewa | 0.0 /100 | #319 | Tragic 4.0% |
| Shoshone | 0.0 /100 | #320 | Tragic 4.0% |
| Paiute | 0.0 /100 | #321 | Tragic 4.1% |
| Seminole | 0.0 /100 | #322 | Tragic 4.1% |
| Apache | 0.0 /100 | #323 | Tragic 4.1% |
| Osage | 0.0 /100 | #324 | Tragic 4.1% |
| Lumbee | 0.0 /100 | #325 | Tragic 4.1% |
| Potawatomi | 0.0 /100 | #326 | Tragic 4.1% |
| Arapaho | 0.0 /100 | #327 | Tragic 4.1% |