Pakistani vs Black/African American Ambulatory Disability
COMPARE
Pakistani
Black/African American
Ambulatory Disability
Ambulatory Disability Comparison
Pakistanis
Blacks/African Americans
6.0%
AMBULATORY DISABILITY
82.5/ 100
METRIC RATING
145th/ 347
METRIC RANK
7.5%
AMBULATORY DISABILITY
0.0/ 100
METRIC RATING
326th/ 347
METRIC RANK
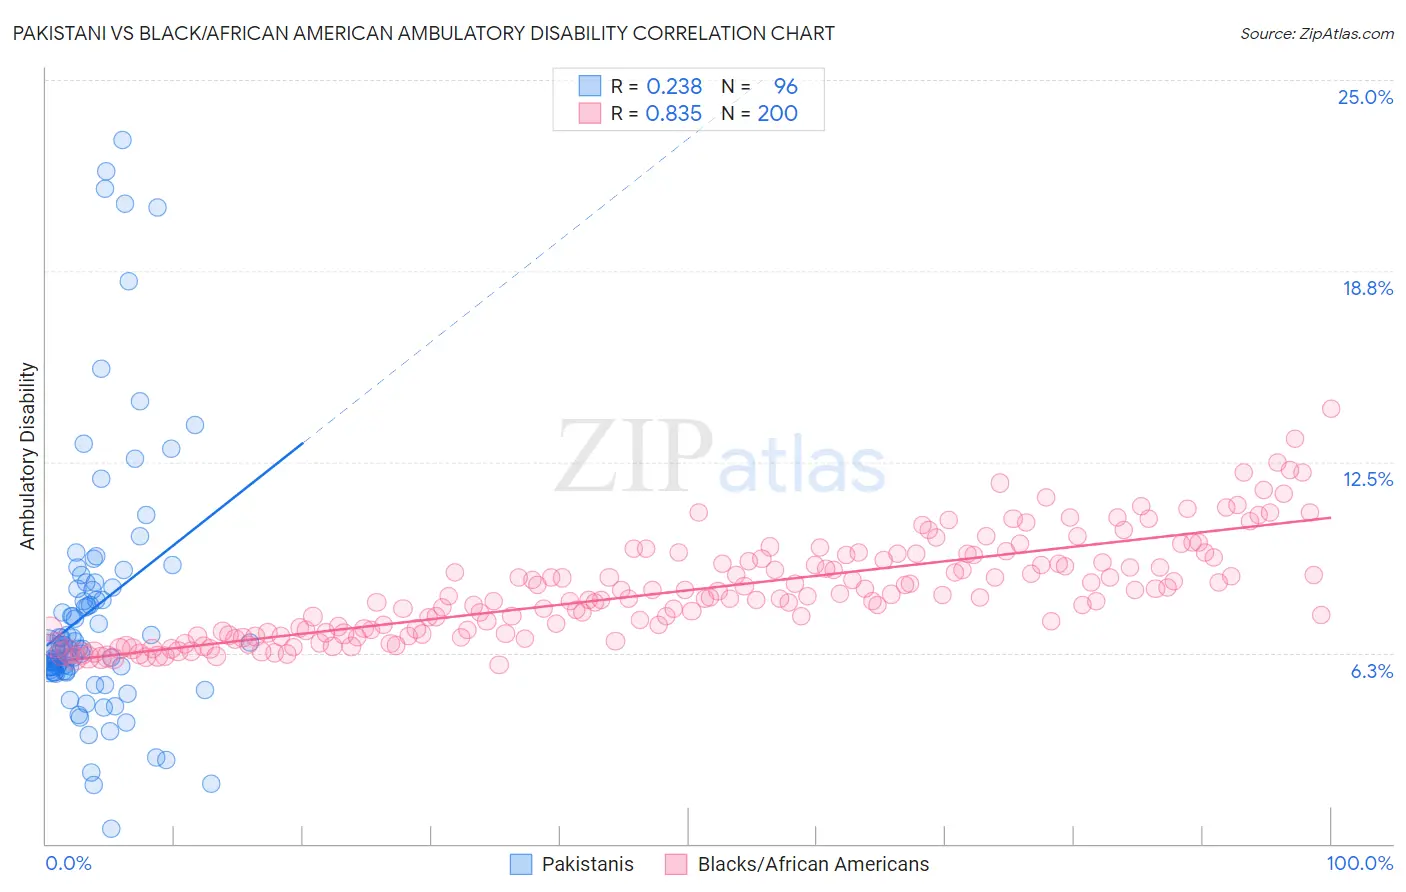
Pakistani vs Black/African American Ambulatory Disability Correlation Chart
The statistical analysis conducted on geographies consisting of 335,239,652 people shows a weak positive correlation between the proportion of Pakistanis and percentage of population with ambulatory disability in the United States with a correlation coefficient (R) of 0.238 and weighted average of 6.0%. Similarly, the statistical analysis conducted on geographies consisting of 565,519,006 people shows a very strong positive correlation between the proportion of Blacks/African Americans and percentage of population with ambulatory disability in the United States with a correlation coefficient (R) of 0.835 and weighted average of 7.5%, a difference of 25.5%.
Ambulatory Disability Correlation Summary
| Measurement | Pakistani | Black/African American |
| Minimum | 0.47% | 5.9% |
| Maximum | 23.0% | 14.3% |
| Range | 22.6% | 8.4% |
| Mean | 7.7% | 8.3% |
| Median | 6.4% | 8.1% |
| Interquartile 25% (IQ1) | 5.6% | 6.9% |
| Interquartile 75% (IQ3) | 8.5% | 9.3% |
| Interquartile Range (IQR) | 2.8% | 2.4% |
| Standard Deviation (Sample) | 4.4% | 1.6% |
| Standard Deviation (Population) | 4.3% | 1.6% |
Similar Demographics by Ambulatory Disability
Demographics Similar to Pakistanis by Ambulatory Disability
In terms of ambulatory disability, the demographic groups most similar to Pakistanis are Immigrants from Greece (6.0%, a difference of 0.0%), Immigrants from Moldova (6.0%, a difference of 0.010%), Macedonian (6.0%, a difference of 0.030%), Romanian (6.0%, a difference of 0.040%), and Immigrants from Philippines (6.0%, a difference of 0.050%).
| Demographics | Rating | Rank | Ambulatory Disability |
| Immigrants | Hungary | 83.9 /100 | #138 | Excellent 6.0% |
| Immigrants | Zaire | 83.6 /100 | #139 | Excellent 6.0% |
| Czechs | 83.3 /100 | #140 | Excellent 6.0% |
| Swedes | 83.1 /100 | #141 | Excellent 6.0% |
| Immigrants | Philippines | 83.0 /100 | #142 | Excellent 6.0% |
| Romanians | 82.9 /100 | #143 | Excellent 6.0% |
| Macedonians | 82.8 /100 | #144 | Excellent 6.0% |
| Pakistanis | 82.5 /100 | #145 | Excellent 6.0% |
| Immigrants | Greece | 82.5 /100 | #146 | Excellent 6.0% |
| Immigrants | Moldova | 82.4 /100 | #147 | Excellent 6.0% |
| Immigrants | Eastern Europe | 82.0 /100 | #148 | Excellent 6.0% |
| Lithuanians | 81.9 /100 | #149 | Excellent 6.0% |
| Maltese | 81.6 /100 | #150 | Excellent 6.0% |
| Greeks | 79.6 /100 | #151 | Good 6.0% |
| Immigrants | Austria | 78.8 /100 | #152 | Good 6.0% |
Demographics Similar to Blacks/African Americans by Ambulatory Disability
In terms of ambulatory disability, the demographic groups most similar to Blacks/African Americans are Native/Alaskan (7.5%, a difference of 0.010%), Comanche (7.5%, a difference of 0.11%), Navajo (7.5%, a difference of 0.18%), Hopi (7.6%, a difference of 0.95%), and Pueblo (7.6%, a difference of 0.99%).
| Demographics | Rating | Rank | Ambulatory Disability |
| Dominicans | 0.0 /100 | #319 | Tragic 7.2% |
| Potawatomi | 0.0 /100 | #320 | Tragic 7.3% |
| Apache | 0.0 /100 | #321 | Tragic 7.4% |
| Osage | 0.0 /100 | #322 | Tragic 7.4% |
| Americans | 0.0 /100 | #323 | Tragic 7.4% |
| Navajo | 0.0 /100 | #324 | Tragic 7.5% |
| Comanche | 0.0 /100 | #325 | Tragic 7.5% |
| Blacks/African Americans | 0.0 /100 | #326 | Tragic 7.5% |
| Natives/Alaskans | 0.0 /100 | #327 | Tragic 7.5% |
| Hopi | 0.0 /100 | #328 | Tragic 7.6% |
| Pueblo | 0.0 /100 | #329 | Tragic 7.6% |
| Paiute | 0.0 /100 | #330 | Tragic 7.7% |
| Cajuns | 0.0 /100 | #331 | Tragic 7.8% |
| Menominee | 0.0 /100 | #332 | Tragic 7.8% |
| Cherokee | 0.0 /100 | #333 | Tragic 7.9% |