Ottawa vs Immigrants from Hong Kong 5th Grade
COMPARE
Ottawa
Immigrants from Hong Kong
5th Grade
5th Grade Comparison
Ottawa
Immigrants from Hong Kong
98.0%
5TH GRADE
99.9/ 100
METRIC RATING
43rd/ 347
METRIC RANK
96.7%
5TH GRADE
0.2/ 100
METRIC RATING
271st/ 347
METRIC RANK
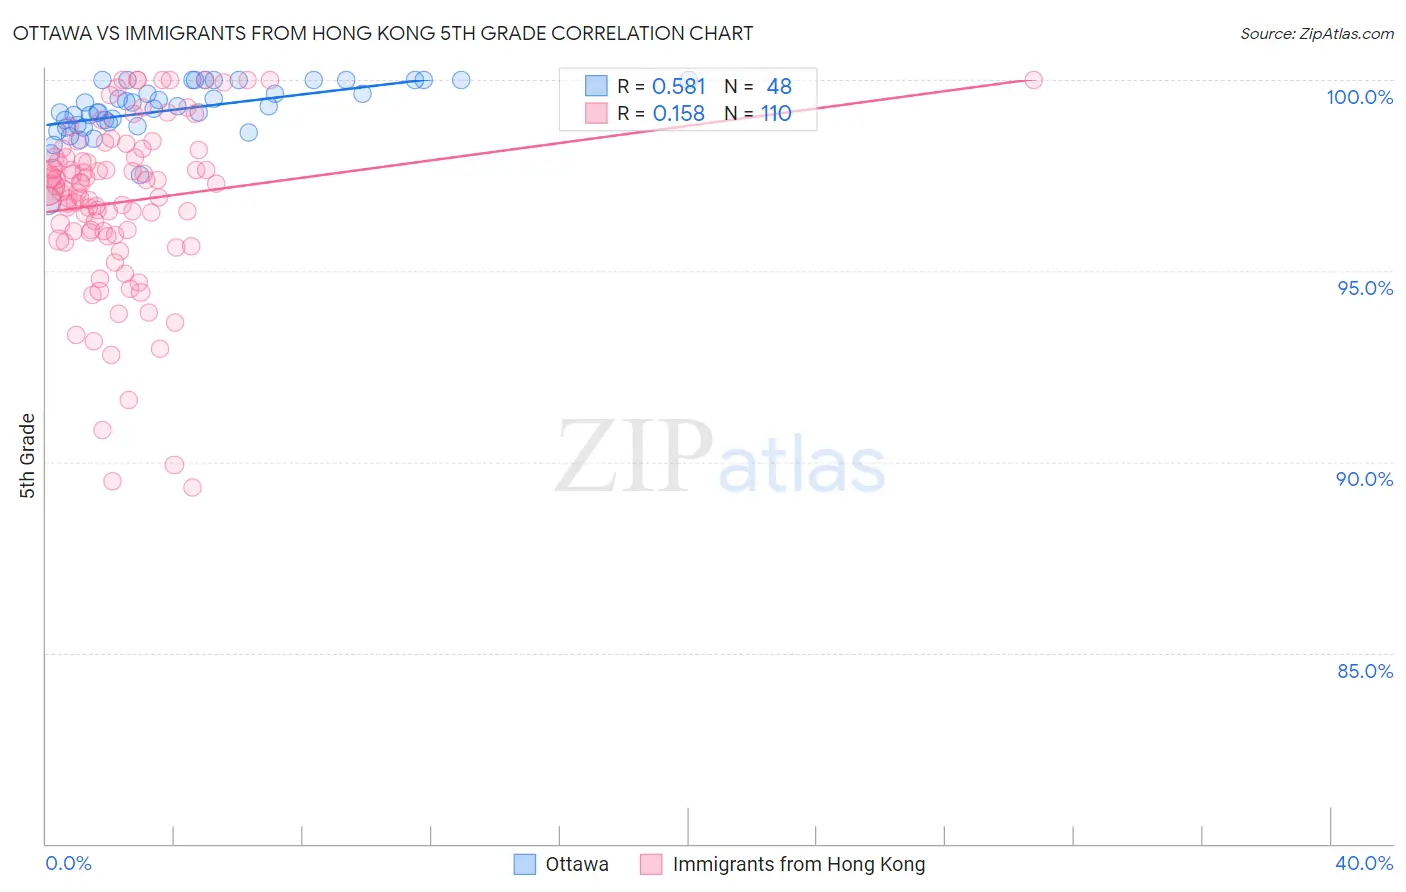
Ottawa vs Immigrants from Hong Kong 5th Grade Correlation Chart
The statistical analysis conducted on geographies consisting of 49,956,726 people shows a substantial positive correlation between the proportion of Ottawa and percentage of population with at least 5th grade education in the United States with a correlation coefficient (R) of 0.581 and weighted average of 98.0%. Similarly, the statistical analysis conducted on geographies consisting of 253,908,350 people shows a poor positive correlation between the proportion of Immigrants from Hong Kong and percentage of population with at least 5th grade education in the United States with a correlation coefficient (R) of 0.158 and weighted average of 96.7%, a difference of 1.4%.
5th Grade Correlation Summary
| Measurement | Ottawa | Immigrants from Hong Kong |
| Minimum | 96.8% | 89.3% |
| Maximum | 100.0% | 100.0% |
| Range | 3.2% | 10.7% |
| Mean | 99.2% | 96.8% |
| Median | 99.3% | 97.2% |
| Interquartile 25% (IQ1) | 98.8% | 96.0% |
| Interquartile 75% (IQ3) | 100.0% | 98.0% |
| Interquartile Range (IQR) | 1.2% | 2.0% |
| Standard Deviation (Sample) | 0.70% | 2.2% |
| Standard Deviation (Population) | 0.69% | 2.2% |
Similar Demographics by 5th Grade
Demographics Similar to Ottawa by 5th Grade
In terms of 5th grade, the demographic groups most similar to Ottawa are Northern European (98.0%, a difference of 0.010%), Aleut (98.0%, a difference of 0.010%), Hungarian (98.0%, a difference of 0.020%), Czechoslovakian (98.0%, a difference of 0.020%), and Arapaho (98.0%, a difference of 0.020%).
| Demographics | Rating | Rank | 5th Grade |
| British | 100.0 /100 | #36 | Exceptional 98.1% |
| Latvians | 99.9 /100 | #37 | Exceptional 98.1% |
| Belgians | 99.9 /100 | #38 | Exceptional 98.1% |
| Luxembourgers | 99.9 /100 | #39 | Exceptional 98.1% |
| Eastern Europeans | 99.9 /100 | #40 | Exceptional 98.1% |
| Hungarians | 99.9 /100 | #41 | Exceptional 98.0% |
| Northern Europeans | 99.9 /100 | #42 | Exceptional 98.0% |
| Ottawa | 99.9 /100 | #43 | Exceptional 98.0% |
| Aleuts | 99.9 /100 | #44 | Exceptional 98.0% |
| Czechoslovakians | 99.9 /100 | #45 | Exceptional 98.0% |
| Arapaho | 99.9 /100 | #46 | Exceptional 98.0% |
| Native Hawaiians | 99.9 /100 | #47 | Exceptional 98.0% |
| Bulgarians | 99.8 /100 | #48 | Exceptional 98.0% |
| Estonians | 99.8 /100 | #49 | Exceptional 98.0% |
| Immigrants | Scotland | 99.8 /100 | #50 | Exceptional 98.0% |
Demographics Similar to Immigrants from Hong Kong by 5th Grade
In terms of 5th grade, the demographic groups most similar to Immigrants from Hong Kong are Afghan (96.7%, a difference of 0.0%), Trinidadian and Tobagonian (96.7%, a difference of 0.010%), Yaqui (96.7%, a difference of 0.020%), Immigrants from Cameroon (96.7%, a difference of 0.020%), and Immigrants from Peru (96.6%, a difference of 0.030%).
| Demographics | Rating | Rank | 5th Grade |
| West Indians | 0.3 /100 | #264 | Tragic 96.8% |
| Taiwanese | 0.3 /100 | #265 | Tragic 96.7% |
| Immigrants | Nigeria | 0.3 /100 | #266 | Tragic 96.7% |
| Immigrants | South America | 0.3 /100 | #267 | Tragic 96.7% |
| Armenians | 0.3 /100 | #268 | Tragic 96.7% |
| Ghanaians | 0.2 /100 | #269 | Tragic 96.7% |
| Afghans | 0.2 /100 | #270 | Tragic 96.7% |
| Immigrants | Hong Kong | 0.2 /100 | #271 | Tragic 96.7% |
| Trinidadians and Tobagonians | 0.1 /100 | #272 | Tragic 96.7% |
| Yaqui | 0.1 /100 | #273 | Tragic 96.7% |
| Immigrants | Cameroon | 0.1 /100 | #274 | Tragic 96.7% |
| Immigrants | Peru | 0.1 /100 | #275 | Tragic 96.6% |
| Cubans | 0.1 /100 | #276 | Tragic 96.6% |
| Immigrants | Bolivia | 0.1 /100 | #277 | Tragic 96.6% |
| Immigrants | Ghana | 0.1 /100 | #278 | Tragic 96.6% |