Immigrants from Haiti vs Central American Hearing Disability
COMPARE
Immigrants from Haiti
Central American
Hearing Disability
Hearing Disability Comparison
Immigrants from Haiti
Central Americans
2.6%
HEARING DISABILITY
99.7/ 100
METRIC RATING
28th/ 347
METRIC RANK
2.7%
HEARING DISABILITY
97.7/ 100
METRIC RATING
71st/ 347
METRIC RANK
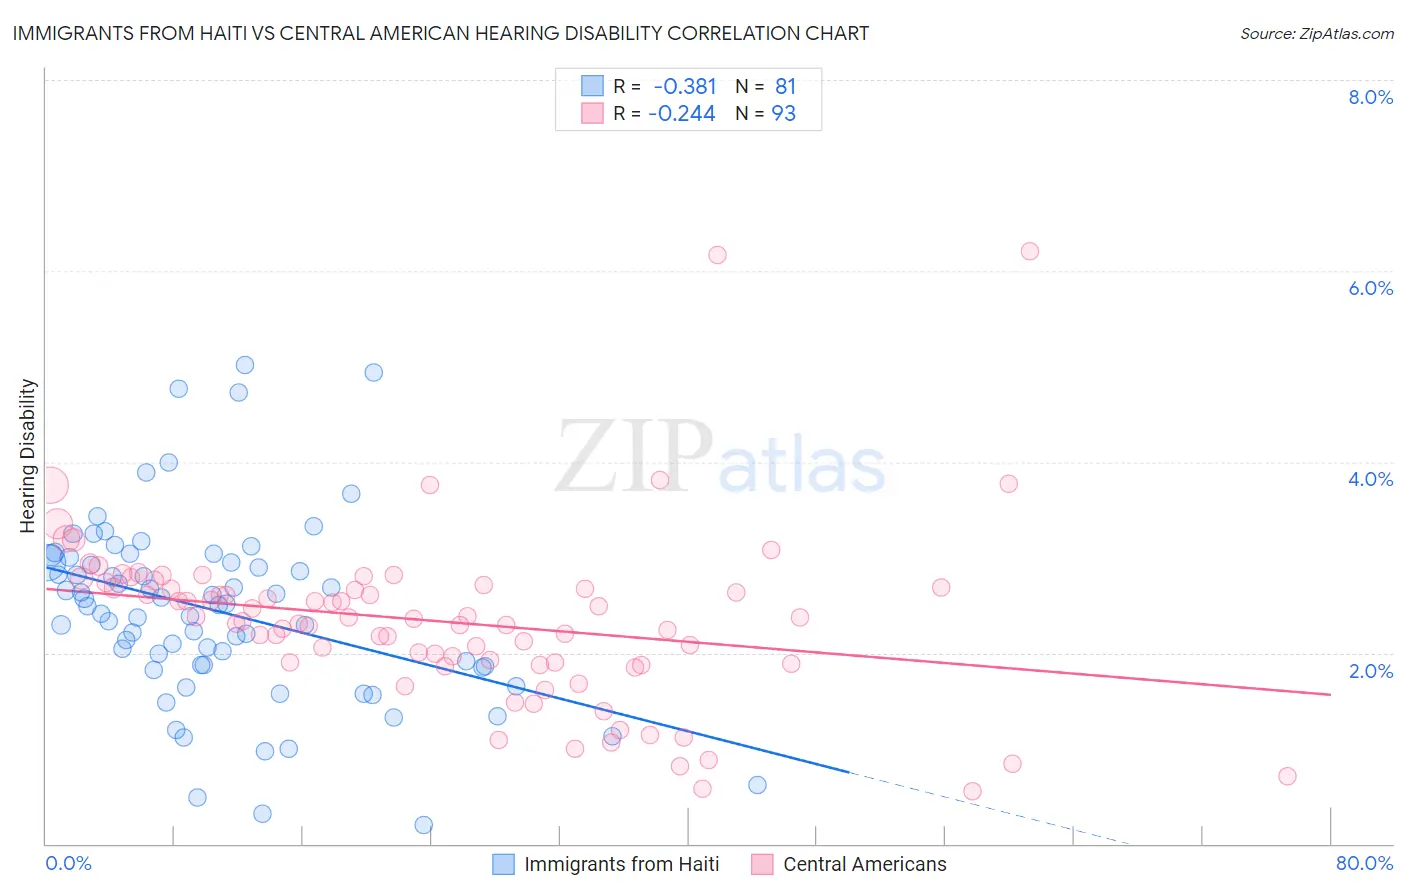
Immigrants from Haiti vs Central American Hearing Disability Correlation Chart
The statistical analysis conducted on geographies consisting of 225,193,212 people shows a mild negative correlation between the proportion of Immigrants from Haiti and percentage of population with hearing disability in the United States with a correlation coefficient (R) of -0.381 and weighted average of 2.6%. Similarly, the statistical analysis conducted on geographies consisting of 504,204,845 people shows a weak negative correlation between the proportion of Central Americans and percentage of population with hearing disability in the United States with a correlation coefficient (R) of -0.244 and weighted average of 2.7%, a difference of 5.4%.
Hearing Disability Correlation Summary
| Measurement | Immigrants from Haiti | Central American |
| Minimum | 0.20% | 0.55% |
| Maximum | 5.0% | 6.2% |
| Range | 4.8% | 5.7% |
| Mean | 2.4% | 2.3% |
| Median | 2.5% | 2.4% |
| Interquartile 25% (IQ1) | 1.9% | 1.9% |
| Interquartile 75% (IQ3) | 3.0% | 2.7% |
| Interquartile Range (IQR) | 1.1% | 0.81% |
| Standard Deviation (Sample) | 0.97% | 0.91% |
| Standard Deviation (Population) | 0.96% | 0.91% |
Similar Demographics by Hearing Disability
Demographics Similar to Immigrants from Haiti by Hearing Disability
In terms of hearing disability, the demographic groups most similar to Immigrants from Haiti are Bolivian (2.6%, a difference of 0.020%), Immigrants from Caribbean (2.6%, a difference of 0.10%), Immigrants from Cameroon (2.6%, a difference of 0.11%), Immigrants from Venezuela (2.6%, a difference of 0.26%), and Immigrants from South Central Asia (2.6%, a difference of 0.37%).
| Demographics | Rating | Rank | Hearing Disability |
| Ghanaians | 99.8 /100 | #21 | Exceptional 2.5% |
| Immigrants | Sierra Leone | 99.8 /100 | #22 | Exceptional 2.6% |
| Immigrants | Nigeria | 99.8 /100 | #23 | Exceptional 2.6% |
| Immigrants | Ghana | 99.8 /100 | #24 | Exceptional 2.6% |
| Immigrants | El Salvador | 99.7 /100 | #25 | Exceptional 2.6% |
| Immigrants | Senegal | 99.7 /100 | #26 | Exceptional 2.6% |
| Immigrants | South Central Asia | 99.7 /100 | #27 | Exceptional 2.6% |
| Immigrants | Haiti | 99.7 /100 | #28 | Exceptional 2.6% |
| Bolivians | 99.7 /100 | #29 | Exceptional 2.6% |
| Immigrants | Caribbean | 99.7 /100 | #30 | Exceptional 2.6% |
| Immigrants | Cameroon | 99.7 /100 | #31 | Exceptional 2.6% |
| Immigrants | Venezuela | 99.7 /100 | #32 | Exceptional 2.6% |
| Filipinos | 99.6 /100 | #33 | Exceptional 2.6% |
| Immigrants | Pakistan | 99.6 /100 | #34 | Exceptional 2.6% |
| Salvadorans | 99.6 /100 | #35 | Exceptional 2.6% |
Demographics Similar to Central Americans by Hearing Disability
In terms of hearing disability, the demographic groups most similar to Central Americans are Peruvian (2.7%, a difference of 0.050%), Afghan (2.7%, a difference of 0.10%), Argentinean (2.7%, a difference of 0.18%), Immigrants from Korea (2.7%, a difference of 0.18%), and Immigrants from Saudi Arabia (2.7%, a difference of 0.21%).
| Demographics | Rating | Rank | Hearing Disability |
| Immigrants | Sri Lanka | 98.4 /100 | #64 | Exceptional 2.7% |
| Immigrants | Nepal | 98.3 /100 | #65 | Exceptional 2.7% |
| Immigrants | Belize | 98.2 /100 | #66 | Exceptional 2.7% |
| Egyptians | 98.1 /100 | #67 | Exceptional 2.7% |
| Immigrants | Africa | 98.0 /100 | #68 | Exceptional 2.7% |
| Nicaraguans | 97.9 /100 | #69 | Exceptional 2.7% |
| Peruvians | 97.7 /100 | #70 | Exceptional 2.7% |
| Central Americans | 97.7 /100 | #71 | Exceptional 2.7% |
| Afghans | 97.6 /100 | #72 | Exceptional 2.7% |
| Argentineans | 97.5 /100 | #73 | Exceptional 2.7% |
| Immigrants | Korea | 97.5 /100 | #74 | Exceptional 2.7% |
| Immigrants | Saudi Arabia | 97.5 /100 | #75 | Exceptional 2.7% |
| Asians | 97.5 /100 | #76 | Exceptional 2.7% |
| Immigrants | Malaysia | 97.5 /100 | #77 | Exceptional 2.7% |
| Mongolians | 97.4 /100 | #78 | Exceptional 2.7% |