Immigrants from Eastern Asia vs Central American Hearing Disability
COMPARE
Immigrants from Eastern Asia
Central American
Hearing Disability
Hearing Disability Comparison
Immigrants from Eastern Asia
Central Americans
2.7%
HEARING DISABILITY
99.0/ 100
METRIC RATING
53rd/ 347
METRIC RANK
2.7%
HEARING DISABILITY
97.7/ 100
METRIC RATING
71st/ 347
METRIC RANK
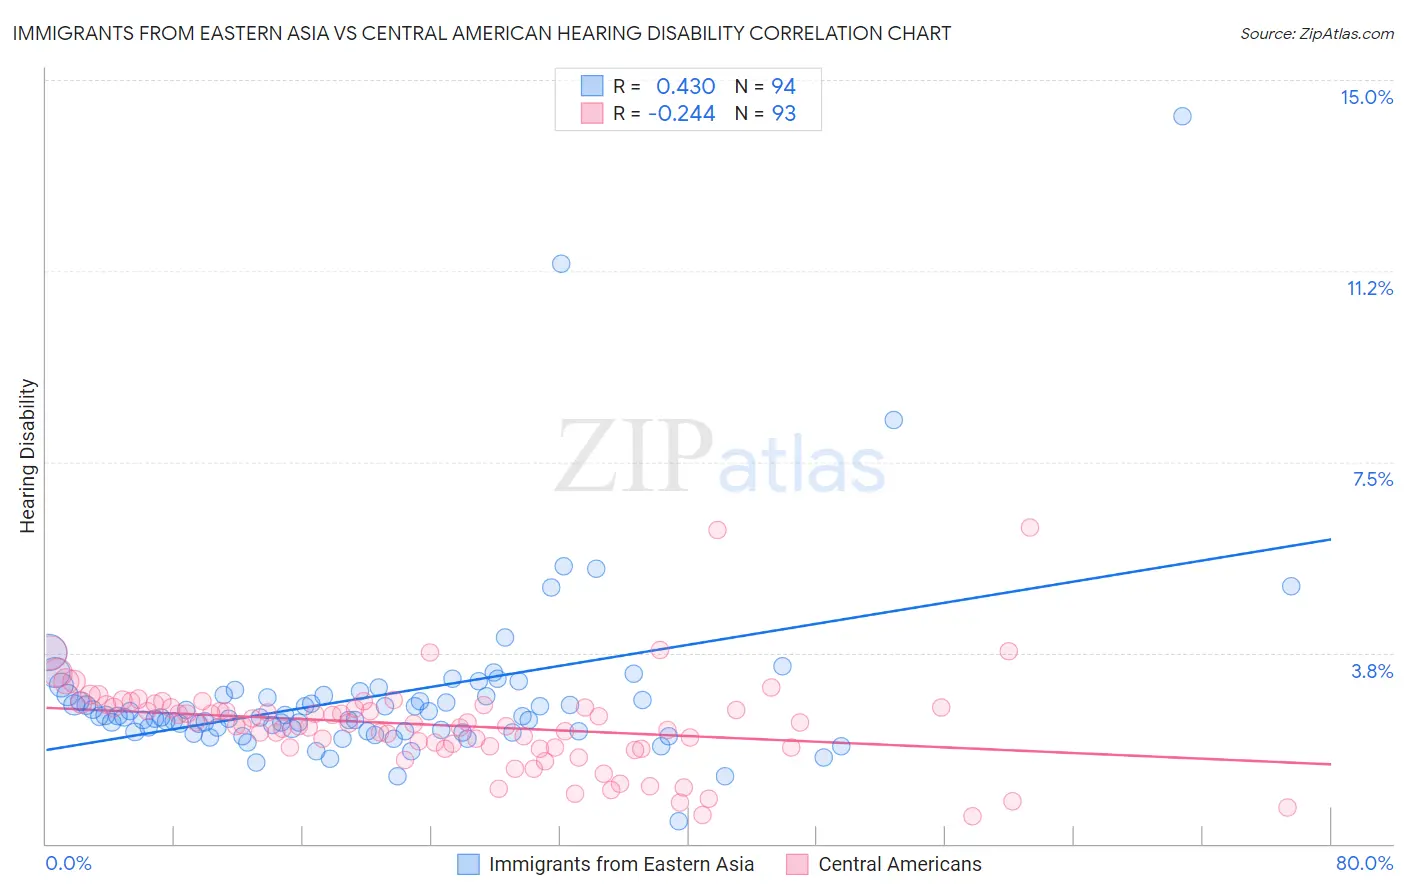
Immigrants from Eastern Asia vs Central American Hearing Disability Correlation Chart
The statistical analysis conducted on geographies consisting of 499,587,634 people shows a moderate positive correlation between the proportion of Immigrants from Eastern Asia and percentage of population with hearing disability in the United States with a correlation coefficient (R) of 0.430 and weighted average of 2.7%. Similarly, the statistical analysis conducted on geographies consisting of 504,204,845 people shows a weak negative correlation between the proportion of Central Americans and percentage of population with hearing disability in the United States with a correlation coefficient (R) of -0.244 and weighted average of 2.7%, a difference of 2.3%.
Hearing Disability Correlation Summary
| Measurement | Immigrants from Eastern Asia | Central American |
| Minimum | 0.45% | 0.55% |
| Maximum | 14.3% | 6.2% |
| Range | 13.8% | 5.7% |
| Mean | 2.9% | 2.3% |
| Median | 2.5% | 2.4% |
| Interquartile 25% (IQ1) | 2.2% | 1.9% |
| Interquartile 75% (IQ3) | 2.9% | 2.7% |
| Interquartile Range (IQR) | 0.71% | 0.81% |
| Standard Deviation (Sample) | 1.8% | 0.91% |
| Standard Deviation (Population) | 1.8% | 0.91% |
Demographics Similar to Immigrants from Eastern Asia and Central Americans by Hearing Disability
In terms of hearing disability, the demographic groups most similar to Immigrants from Eastern Asia are Ethiopian (2.7%, a difference of 0.030%), Jamaican (2.7%, a difference of 0.070%), Immigrants from Ethiopia (2.7%, a difference of 0.10%), Immigrants from Nicaragua (2.7%, a difference of 0.12%), and South American (2.7%, a difference of 0.16%). Similarly, the demographic groups most similar to Central Americans are Peruvian (2.7%, a difference of 0.050%), Afghan (2.7%, a difference of 0.10%), Nicaraguan (2.7%, a difference of 0.28%), Immigrants from Africa (2.7%, a difference of 0.32%), and Egyptian (2.7%, a difference of 0.45%).
| Demographics | Rating | Rank | Hearing Disability |
| Jamaicans | 99.0 /100 | #52 | Exceptional 2.7% |
| Immigrants | Eastern Asia | 99.0 /100 | #53 | Exceptional 2.7% |
| Ethiopians | 99.0 /100 | #54 | Exceptional 2.7% |
| Immigrants | Ethiopia | 99.0 /100 | #55 | Exceptional 2.7% |
| Immigrants | Nicaragua | 99.0 /100 | #56 | Exceptional 2.7% |
| South Americans | 99.0 /100 | #57 | Exceptional 2.7% |
| Immigrants | Peru | 98.6 /100 | #58 | Exceptional 2.7% |
| Immigrants | Eritrea | 98.5 /100 | #59 | Exceptional 2.7% |
| Immigrants | Egypt | 98.5 /100 | #60 | Exceptional 2.7% |
| Immigrants | Uzbekistan | 98.4 /100 | #61 | Exceptional 2.7% |
| Immigrants | Colombia | 98.4 /100 | #62 | Exceptional 2.7% |
| Indians (Asian) | 98.4 /100 | #63 | Exceptional 2.7% |
| Immigrants | Sri Lanka | 98.4 /100 | #64 | Exceptional 2.7% |
| Immigrants | Nepal | 98.3 /100 | #65 | Exceptional 2.7% |
| Immigrants | Belize | 98.2 /100 | #66 | Exceptional 2.7% |
| Egyptians | 98.1 /100 | #67 | Exceptional 2.7% |
| Immigrants | Africa | 98.0 /100 | #68 | Exceptional 2.7% |
| Nicaraguans | 97.9 /100 | #69 | Exceptional 2.7% |
| Peruvians | 97.7 /100 | #70 | Exceptional 2.7% |
| Central Americans | 97.7 /100 | #71 | Exceptional 2.7% |
| Afghans | 97.6 /100 | #72 | Exceptional 2.7% |