Ottawa vs Central American Seniors Poverty Over the Age of 65
COMPARE
Ottawa
Central American
Seniors Poverty Over the Age of 65
Seniors Poverty Over the Age of 65 Comparison
Ottawa
Central Americans
10.4%
SENIORS POVERTY OVER THE AGE OF 65
88.5/ 100
METRIC RATING
128th/ 347
METRIC RANK
13.4%
SENIORS POVERTY OVER THE AGE OF 65
0.0/ 100
METRIC RATING
283rd/ 347
METRIC RANK
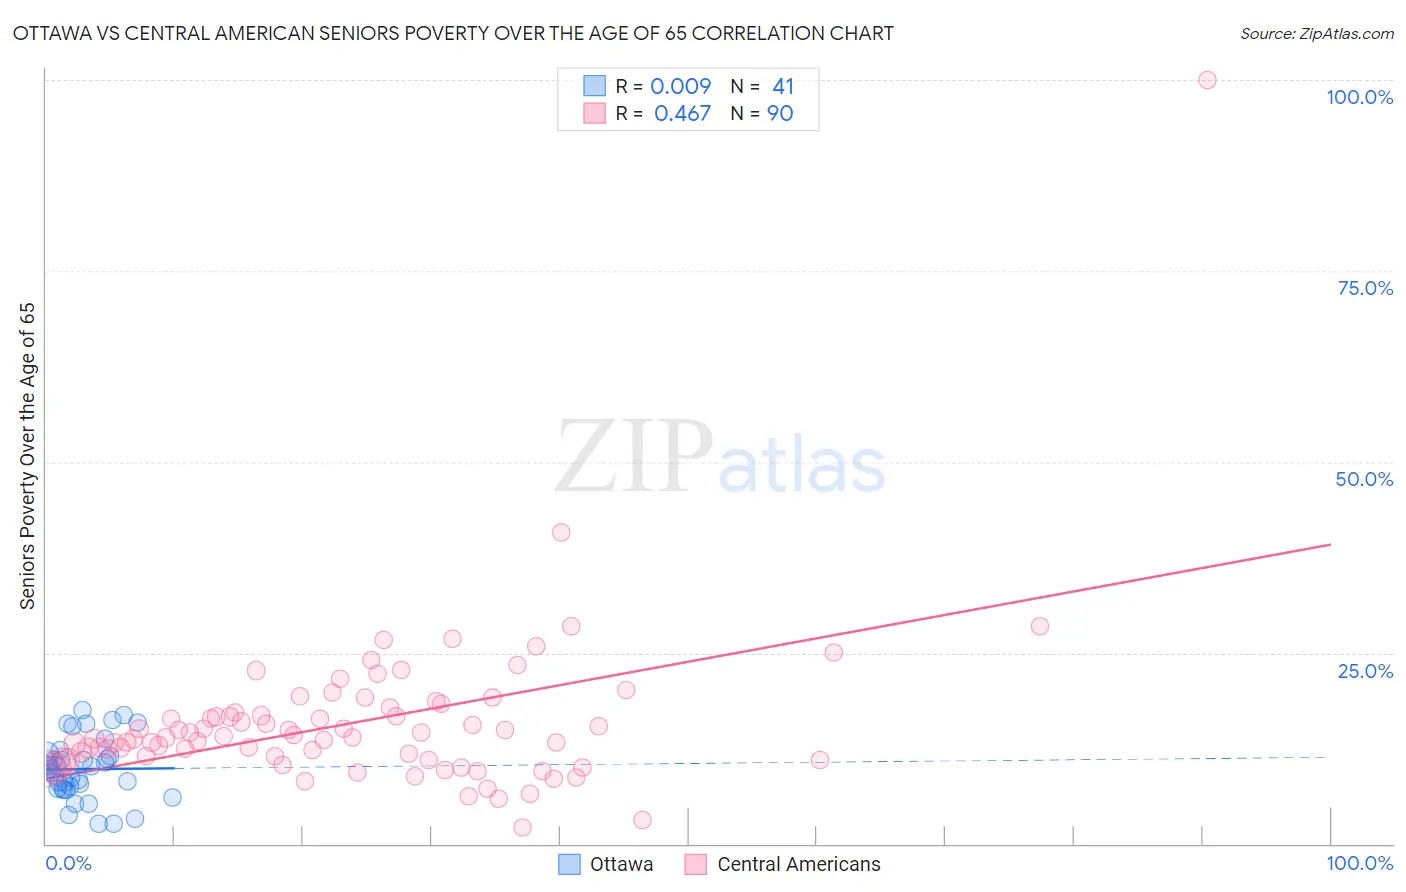
Ottawa vs Central American Seniors Poverty Over the Age of 65 Correlation Chart
The statistical analysis conducted on geographies consisting of 49,903,467 people shows no correlation between the proportion of Ottawa and poverty level among seniors over the age of 65 in the United States with a correlation coefficient (R) of 0.009 and weighted average of 10.4%. Similarly, the statistical analysis conducted on geographies consisting of 501,778,259 people shows a moderate positive correlation between the proportion of Central Americans and poverty level among seniors over the age of 65 in the United States with a correlation coefficient (R) of 0.467 and weighted average of 13.4%, a difference of 28.2%.
Seniors Poverty Over the Age of 65 Correlation Summary
| Measurement | Ottawa | Central American |
| Minimum | 2.6% | 2.1% |
| Maximum | 17.5% | 100.0% |
| Range | 14.9% | 97.9% |
| Mean | 9.8% | 15.8% |
| Median | 9.8% | 13.9% |
| Interquartile 25% (IQ1) | 7.2% | 11.0% |
| Interquartile 75% (IQ3) | 11.6% | 17.2% |
| Interquartile Range (IQR) | 4.3% | 6.3% |
| Standard Deviation (Sample) | 3.9% | 10.8% |
| Standard Deviation (Population) | 3.9% | 10.8% |
Similar Demographics by Seniors Poverty Over the Age of 65
Demographics Similar to Ottawa by Seniors Poverty Over the Age of 65
In terms of seniors poverty over the age of 65, the demographic groups most similar to Ottawa are Immigrants from Iran (10.4%, a difference of 0.020%), Immigrants from Oceania (10.4%, a difference of 0.020%), Immigrants from Hungary (10.4%, a difference of 0.13%), Cambodian (10.4%, a difference of 0.13%), and Egyptian (10.5%, a difference of 0.17%).
| Demographics | Rating | Rank | Seniors Poverty Over the Age of 65 |
| Immigrants | Iraq | 90.7 /100 | #121 | Exceptional 10.4% |
| Immigrants | Moldova | 90.7 /100 | #122 | Exceptional 10.4% |
| Hmong | 90.0 /100 | #123 | Exceptional 10.4% |
| Asians | 89.9 /100 | #124 | Excellent 10.4% |
| Immigrants | Philippines | 89.4 /100 | #125 | Excellent 10.4% |
| Immigrants | Hungary | 89.1 /100 | #126 | Excellent 10.4% |
| Cambodians | 89.1 /100 | #127 | Excellent 10.4% |
| Ottawa | 88.5 /100 | #128 | Excellent 10.4% |
| Immigrants | Iran | 88.4 /100 | #129 | Excellent 10.4% |
| Immigrants | Oceania | 88.4 /100 | #130 | Excellent 10.4% |
| Egyptians | 87.8 /100 | #131 | Excellent 10.5% |
| Immigrants | Turkey | 87.7 /100 | #132 | Excellent 10.5% |
| Guamanians/Chamorros | 87.5 /100 | #133 | Excellent 10.5% |
| Sierra Leoneans | 86.8 /100 | #134 | Excellent 10.5% |
| Immigrants | Norway | 86.5 /100 | #135 | Excellent 10.5% |
Demographics Similar to Central Americans by Seniors Poverty Over the Age of 65
In terms of seniors poverty over the age of 65, the demographic groups most similar to Central Americans are Senegalese (13.3%, a difference of 0.82%), Colville (13.5%, a difference of 0.89%), Guatemalan (13.5%, a difference of 1.1%), Immigrants from Senegal (13.6%, a difference of 1.4%), and Immigrants from Mexico (13.6%, a difference of 1.5%).
| Demographics | Rating | Rank | Seniors Poverty Over the Age of 65 |
| Immigrants | Azores | 0.0 /100 | #276 | Tragic 12.9% |
| Paiute | 0.0 /100 | #277 | Tragic 12.9% |
| Immigrants | Bahamas | 0.0 /100 | #278 | Tragic 13.0% |
| Mexicans | 0.0 /100 | #279 | Tragic 13.1% |
| Yuman | 0.0 /100 | #280 | Tragic 13.1% |
| Immigrants | El Salvador | 0.0 /100 | #281 | Tragic 13.1% |
| Senegalese | 0.0 /100 | #282 | Tragic 13.3% |
| Central Americans | 0.0 /100 | #283 | Tragic 13.4% |
| Colville | 0.0 /100 | #284 | Tragic 13.5% |
| Guatemalans | 0.0 /100 | #285 | Tragic 13.5% |
| Immigrants | Senegal | 0.0 /100 | #286 | Tragic 13.6% |
| Immigrants | Mexico | 0.0 /100 | #287 | Tragic 13.6% |
| Belizeans | 0.0 /100 | #288 | Tragic 13.6% |
| Jamaicans | 0.0 /100 | #289 | Tragic 13.6% |
| Immigrants | Central America | 0.0 /100 | #290 | Tragic 13.6% |