Immigrants from the Azores vs British West Indian Hearing Disability
COMPARE
Immigrants from the Azores
British West Indian
Hearing Disability
Hearing Disability Comparison
Immigrants from the Azores
British West Indians
3.7%
HEARING DISABILITY
0.0/ 100
METRIC RATING
297th/ 347
METRIC RANK
2.4%
HEARING DISABILITY
100.0/ 100
METRIC RATING
8th/ 347
METRIC RANK
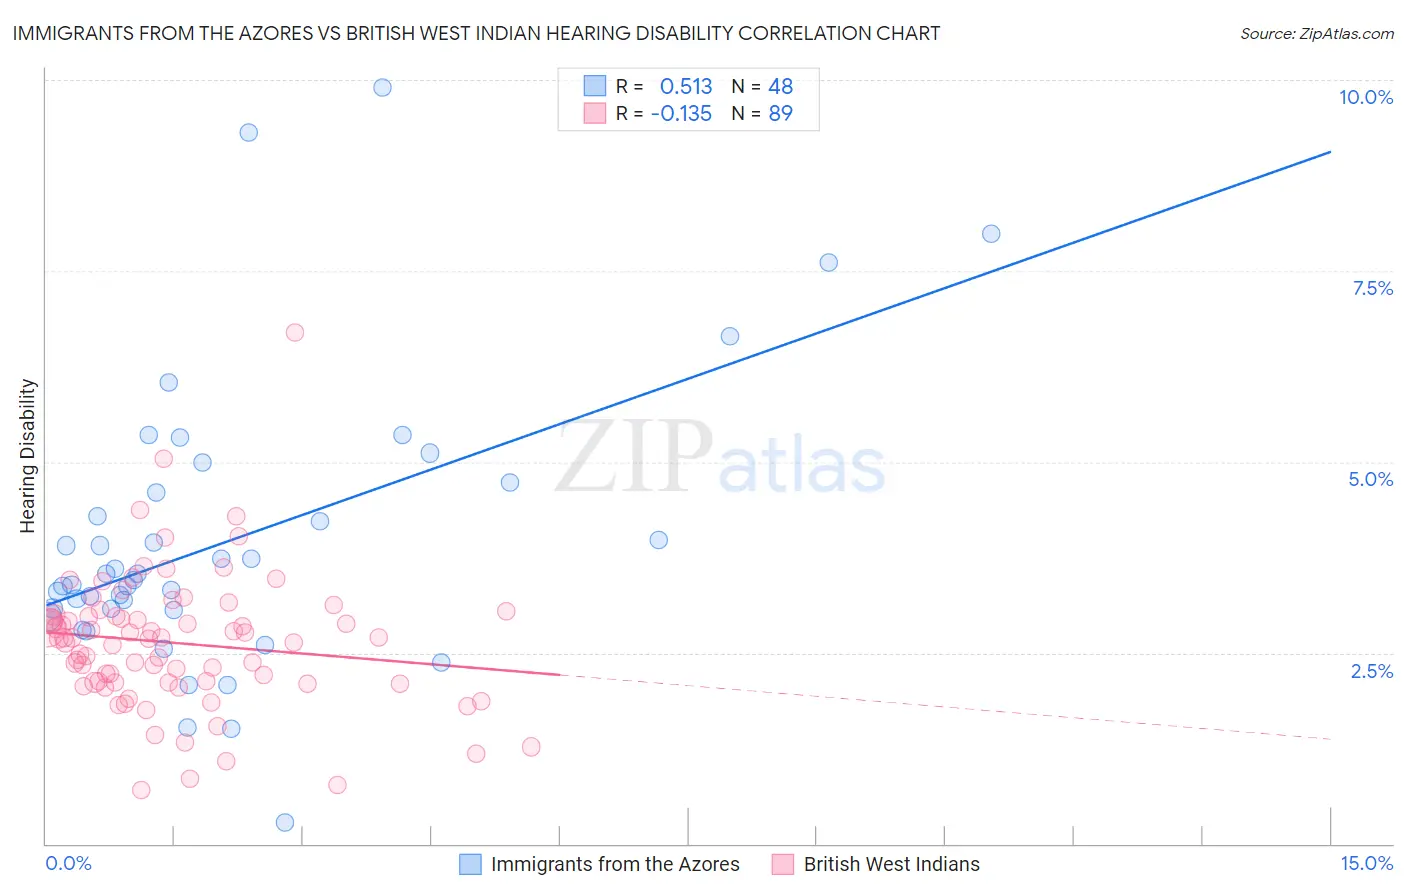
Immigrants from the Azores vs British West Indian Hearing Disability Correlation Chart
The statistical analysis conducted on geographies consisting of 46,255,123 people shows a substantial positive correlation between the proportion of Immigrants from the Azores and percentage of population with hearing disability in the United States with a correlation coefficient (R) of 0.513 and weighted average of 3.7%. Similarly, the statistical analysis conducted on geographies consisting of 152,668,246 people shows a poor negative correlation between the proportion of British West Indians and percentage of population with hearing disability in the United States with a correlation coefficient (R) of -0.135 and weighted average of 2.4%, a difference of 52.9%.
Hearing Disability Correlation Summary
| Measurement | Immigrants from the Azores | British West Indian |
| Minimum | 0.28% | 0.70% |
| Maximum | 9.9% | 6.7% |
| Range | 9.6% | 6.0% |
| Mean | 4.0% | 2.6% |
| Median | 3.5% | 2.7% |
| Interquartile 25% (IQ1) | 3.1% | 2.1% |
| Interquartile 75% (IQ3) | 4.7% | 3.0% |
| Interquartile Range (IQR) | 1.6% | 0.87% |
| Standard Deviation (Sample) | 1.9% | 0.90% |
| Standard Deviation (Population) | 1.9% | 0.89% |
Similar Demographics by Hearing Disability
Demographics Similar to Immigrants from the Azores by Hearing Disability
In terms of hearing disability, the demographic groups most similar to Immigrants from the Azores are Pima (3.7%, a difference of 0.070%), Celtic (3.7%, a difference of 0.19%), Welsh (3.7%, a difference of 0.20%), Iroquois (3.7%, a difference of 0.46%), and German (3.7%, a difference of 0.47%).
| Demographics | Rating | Rank | Hearing Disability |
| Whites/Caucasians | 0.0 /100 | #290 | Tragic 3.7% |
| Finns | 0.0 /100 | #291 | Tragic 3.7% |
| Native Hawaiians | 0.0 /100 | #292 | Tragic 3.7% |
| Norwegians | 0.0 /100 | #293 | Tragic 3.7% |
| Iroquois | 0.0 /100 | #294 | Tragic 3.7% |
| Welsh | 0.0 /100 | #295 | Tragic 3.7% |
| Pima | 0.0 /100 | #296 | Tragic 3.7% |
| Immigrants | Azores | 0.0 /100 | #297 | Tragic 3.7% |
| Celtics | 0.0 /100 | #298 | Tragic 3.7% |
| Germans | 0.0 /100 | #299 | Tragic 3.7% |
| Scottish | 0.0 /100 | #300 | Tragic 3.7% |
| Pennsylvania Germans | 0.0 /100 | #301 | Tragic 3.7% |
| Dutch | 0.0 /100 | #302 | Tragic 3.7% |
| Menominee | 0.0 /100 | #303 | Tragic 3.7% |
| French | 0.0 /100 | #304 | Tragic 3.8% |
Demographics Similar to British West Indians by Hearing Disability
In terms of hearing disability, the demographic groups most similar to British West Indians are Immigrants from Bangladesh (2.4%, a difference of 0.22%), Immigrants from Dominican Republic (2.4%, a difference of 0.78%), Vietnamese (2.4%, a difference of 1.8%), Immigrants from Ecuador (2.5%, a difference of 1.8%), and Immigrants from Trinidad and Tobago (2.5%, a difference of 2.4%).
| Demographics | Rating | Rank | Hearing Disability |
| Immigrants | Grenada | 100.0 /100 | #1 | Exceptional 2.2% |
| Immigrants | St. Vincent and the Grenadines | 100.0 /100 | #2 | Exceptional 2.3% |
| Guyanese | 100.0 /100 | #3 | Exceptional 2.3% |
| Immigrants | Guyana | 100.0 /100 | #4 | Exceptional 2.3% |
| Immigrants | Barbados | 100.0 /100 | #5 | Exceptional 2.4% |
| Vietnamese | 100.0 /100 | #6 | Exceptional 2.4% |
| Immigrants | Bangladesh | 100.0 /100 | #7 | Exceptional 2.4% |
| British West Indians | 100.0 /100 | #8 | Exceptional 2.4% |
| Immigrants | Dominican Republic | 100.0 /100 | #9 | Exceptional 2.4% |
| Immigrants | Ecuador | 99.9 /100 | #10 | Exceptional 2.5% |
| Immigrants | Trinidad and Tobago | 99.9 /100 | #11 | Exceptional 2.5% |
| Trinidadians and Tobagonians | 99.9 /100 | #12 | Exceptional 2.5% |
| Sierra Leoneans | 99.9 /100 | #13 | Exceptional 2.5% |
| Ecuadorians | 99.9 /100 | #14 | Exceptional 2.5% |
| Barbadians | 99.9 /100 | #15 | Exceptional 2.5% |