Macedonian vs British West Indian Hearing Disability
COMPARE
Macedonian
British West Indian
Hearing Disability
Hearing Disability Comparison
Macedonians
British West Indians
3.1%
HEARING DISABILITY
27.0/ 100
METRIC RATING
193rd/ 347
METRIC RANK
2.4%
HEARING DISABILITY
100.0/ 100
METRIC RATING
8th/ 347
METRIC RANK
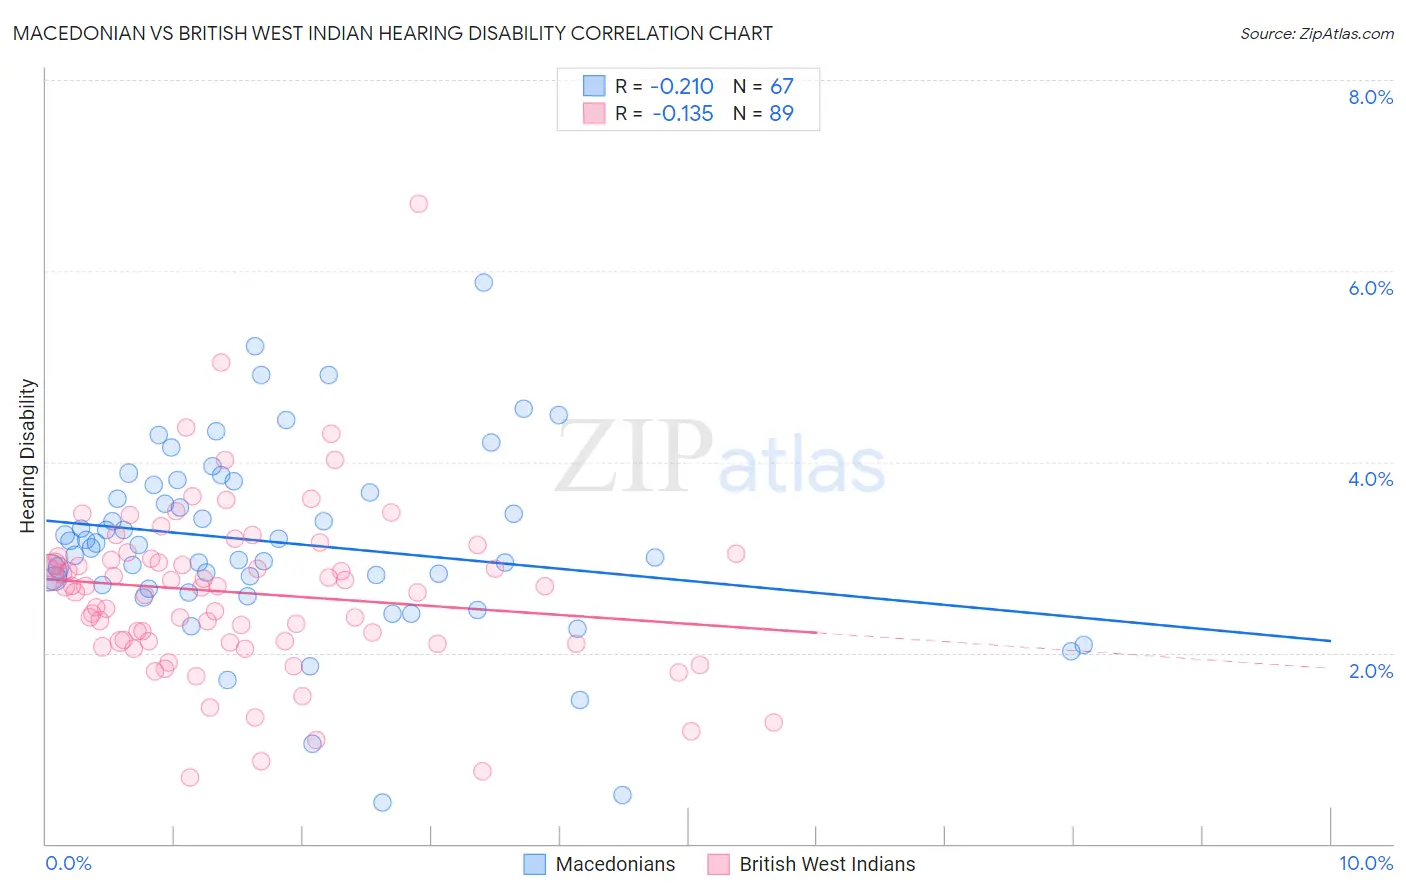
Macedonian vs British West Indian Hearing Disability Correlation Chart
The statistical analysis conducted on geographies consisting of 132,651,102 people shows a weak negative correlation between the proportion of Macedonians and percentage of population with hearing disability in the United States with a correlation coefficient (R) of -0.210 and weighted average of 3.1%. Similarly, the statistical analysis conducted on geographies consisting of 152,668,246 people shows a poor negative correlation between the proportion of British West Indians and percentage of population with hearing disability in the United States with a correlation coefficient (R) of -0.135 and weighted average of 2.4%, a difference of 26.1%.
Hearing Disability Correlation Summary
| Measurement | Macedonian | British West Indian |
| Minimum | 0.44% | 0.70% |
| Maximum | 5.9% | 6.7% |
| Range | 5.4% | 6.0% |
| Mean | 3.2% | 2.6% |
| Median | 3.1% | 2.7% |
| Interquartile 25% (IQ1) | 2.7% | 2.1% |
| Interquartile 75% (IQ3) | 3.8% | 3.0% |
| Interquartile Range (IQR) | 1.1% | 0.87% |
| Standard Deviation (Sample) | 0.99% | 0.90% |
| Standard Deviation (Population) | 0.99% | 0.89% |
Similar Demographics by Hearing Disability
Demographics Similar to Macedonians by Hearing Disability
In terms of hearing disability, the demographic groups most similar to Macedonians are Korean (3.1%, a difference of 0.080%), Immigrants from Switzerland (3.1%, a difference of 0.21%), South African (3.1%, a difference of 0.30%), Spanish American Indian (3.1%, a difference of 0.35%), and Immigrants from South Africa (3.1%, a difference of 0.46%).
| Demographics | Rating | Rank | Hearing Disability |
| Immigrants | Mexico | 34.9 /100 | #186 | Fair 3.0% |
| Blacks/African Americans | 34.7 /100 | #187 | Fair 3.0% |
| Mexican American Indians | 34.7 /100 | #188 | Fair 3.0% |
| Africans | 32.9 /100 | #189 | Fair 3.0% |
| Immigrants | South Africa | 31.1 /100 | #190 | Fair 3.1% |
| Immigrants | Switzerland | 28.8 /100 | #191 | Fair 3.1% |
| Koreans | 27.6 /100 | #192 | Fair 3.1% |
| Macedonians | 27.0 /100 | #193 | Fair 3.1% |
| South Africans | 24.5 /100 | #194 | Fair 3.1% |
| Spanish American Indians | 24.1 /100 | #195 | Fair 3.1% |
| Immigrants | Europe | 22.9 /100 | #196 | Fair 3.1% |
| Immigrants | Bosnia and Herzegovina | 20.6 /100 | #197 | Fair 3.1% |
| Immigrants | Croatia | 20.5 /100 | #198 | Fair 3.1% |
| Syrians | 19.2 /100 | #199 | Poor 3.1% |
| Immigrants | North Macedonia | 19.1 /100 | #200 | Poor 3.1% |
Demographics Similar to British West Indians by Hearing Disability
In terms of hearing disability, the demographic groups most similar to British West Indians are Immigrants from Bangladesh (2.4%, a difference of 0.22%), Immigrants from Dominican Republic (2.4%, a difference of 0.78%), Vietnamese (2.4%, a difference of 1.8%), Immigrants from Ecuador (2.5%, a difference of 1.8%), and Immigrants from Trinidad and Tobago (2.5%, a difference of 2.4%).
| Demographics | Rating | Rank | Hearing Disability |
| Immigrants | Grenada | 100.0 /100 | #1 | Exceptional 2.2% |
| Immigrants | St. Vincent and the Grenadines | 100.0 /100 | #2 | Exceptional 2.3% |
| Guyanese | 100.0 /100 | #3 | Exceptional 2.3% |
| Immigrants | Guyana | 100.0 /100 | #4 | Exceptional 2.3% |
| Immigrants | Barbados | 100.0 /100 | #5 | Exceptional 2.4% |
| Vietnamese | 100.0 /100 | #6 | Exceptional 2.4% |
| Immigrants | Bangladesh | 100.0 /100 | #7 | Exceptional 2.4% |
| British West Indians | 100.0 /100 | #8 | Exceptional 2.4% |
| Immigrants | Dominican Republic | 100.0 /100 | #9 | Exceptional 2.4% |
| Immigrants | Ecuador | 99.9 /100 | #10 | Exceptional 2.5% |
| Immigrants | Trinidad and Tobago | 99.9 /100 | #11 | Exceptional 2.5% |
| Trinidadians and Tobagonians | 99.9 /100 | #12 | Exceptional 2.5% |
| Sierra Leoneans | 99.9 /100 | #13 | Exceptional 2.5% |
| Ecuadorians | 99.9 /100 | #14 | Exceptional 2.5% |
| Barbadians | 99.9 /100 | #15 | Exceptional 2.5% |