Osage vs Kenyan Householder Income Under 25 years
COMPARE
Osage
Kenyan
Householder Income Under 25 years
Householder Income Under 25 years Comparison
Osage
Kenyans
$45,764
HOUSEHOLDER INCOME UNDER 25 YEARS
0.0/ 100
METRIC RATING
326th/ 347
METRIC RANK
$50,815
HOUSEHOLDER INCOME UNDER 25 YEARS
3.3/ 100
METRIC RATING
234th/ 347
METRIC RANK
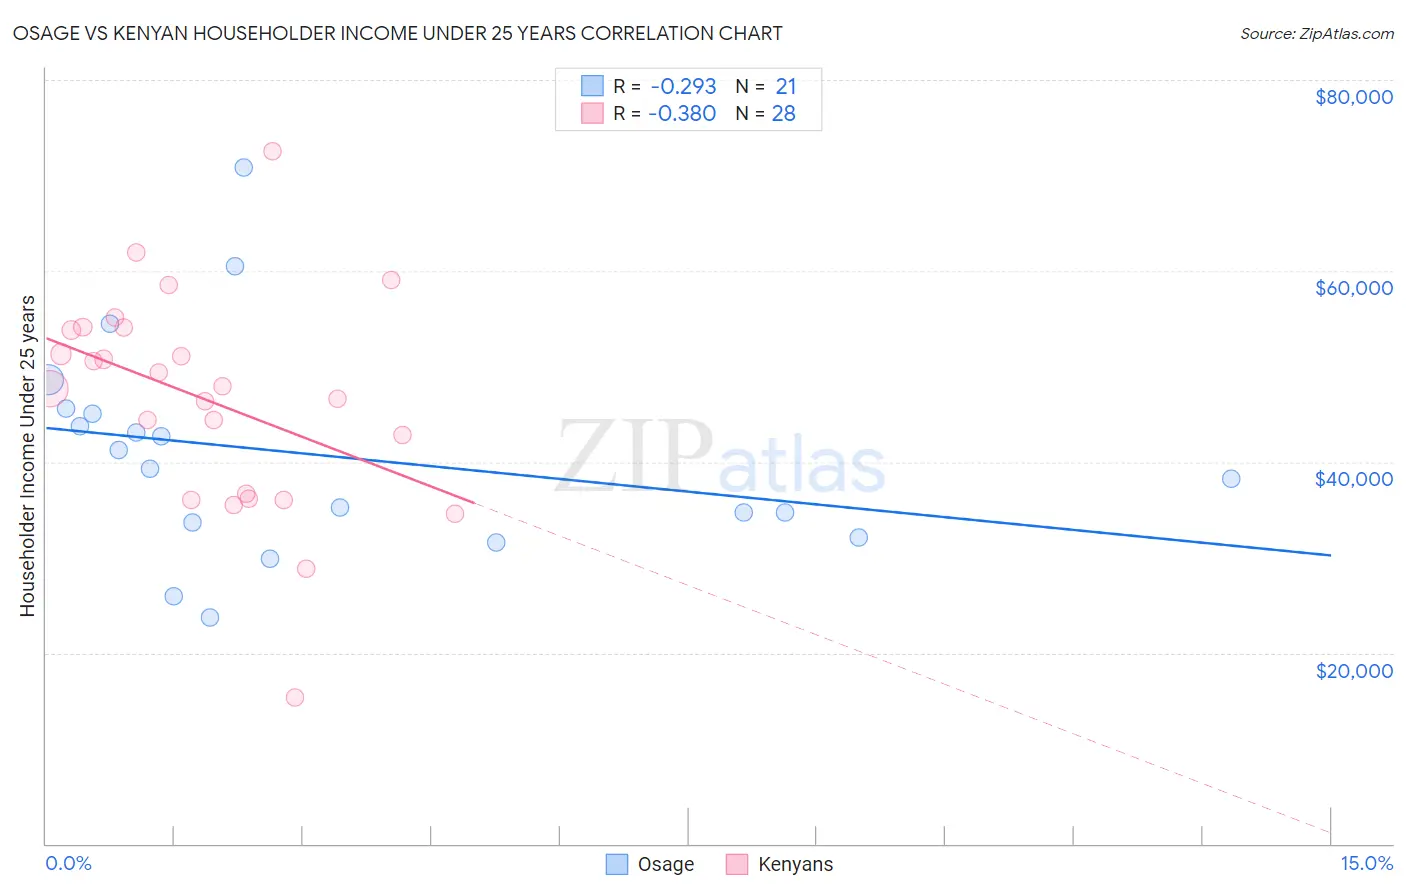
Osage vs Kenyan Householder Income Under 25 years Correlation Chart
The statistical analysis conducted on geographies consisting of 87,289,691 people shows a weak negative correlation between the proportion of Osage and household income with householder under the age of 25 in the United States with a correlation coefficient (R) of -0.293 and weighted average of $45,764. Similarly, the statistical analysis conducted on geographies consisting of 155,087,002 people shows a mild negative correlation between the proportion of Kenyans and household income with householder under the age of 25 in the United States with a correlation coefficient (R) of -0.380 and weighted average of $50,815, a difference of 11.0%.
Householder Income Under 25 years Correlation Summary
| Measurement | Osage | Kenyan |
| Minimum | $23,750 | $15,272 |
| Maximum | $70,795 | $72,514 |
| Range | $47,045 | $57,242 |
| Mean | $40,691 | $46,465 |
| Median | $39,256 | $47,808 |
| Interquartile 25% (IQ1) | $32,844 | $36,370 |
| Interquartile 75% (IQ3) | $45,298 | $53,945 |
| Interquartile Range (IQR) | $12,454 | $17,574 |
| Standard Deviation (Sample) | $11,304 | $11,475 |
| Standard Deviation (Population) | $11,031 | $11,268 |
Similar Demographics by Householder Income Under 25 years
Demographics Similar to Osage by Householder Income Under 25 years
In terms of householder income under 25 years, the demographic groups most similar to Osage are Bahamian ($45,743, a difference of 0.050%), Immigrants from Bahamas ($45,793, a difference of 0.060%), Dutch West Indian ($45,816, a difference of 0.11%), German Russian ($45,673, a difference of 0.20%), and Seminole ($45,649, a difference of 0.25%).
| Demographics | Rating | Rank | Householder Income Under 25 years |
| Africans | 0.0 /100 | #319 | Tragic $46,838 |
| Immigrants | Sudan | 0.0 /100 | #320 | Tragic $46,791 |
| Potawatomi | 0.0 /100 | #321 | Tragic $46,462 |
| Sioux | 0.0 /100 | #322 | Tragic $46,417 |
| Immigrants | Saudi Arabia | 0.0 /100 | #323 | Tragic $46,187 |
| Dutch West Indians | 0.0 /100 | #324 | Tragic $45,816 |
| Immigrants | Bahamas | 0.0 /100 | #325 | Tragic $45,793 |
| Osage | 0.0 /100 | #326 | Tragic $45,764 |
| Bahamians | 0.0 /100 | #327 | Tragic $45,743 |
| German Russians | 0.0 /100 | #328 | Tragic $45,673 |
| Seminole | 0.0 /100 | #329 | Tragic $45,649 |
| Indonesians | 0.0 /100 | #330 | Tragic $45,566 |
| Immigrants | Zaire | 0.0 /100 | #331 | Tragic $45,529 |
| Choctaw | 0.0 /100 | #332 | Tragic $45,450 |
| Creek | 0.0 /100 | #333 | Tragic $45,371 |
Demographics Similar to Kenyans by Householder Income Under 25 years
In terms of householder income under 25 years, the demographic groups most similar to Kenyans are Spanish ($50,813, a difference of 0.0%), English ($50,805, a difference of 0.020%), German ($50,804, a difference of 0.020%), Iraqi ($50,802, a difference of 0.030%), and Pennsylvania German ($50,852, a difference of 0.070%).
| Demographics | Rating | Rank | Householder Income Under 25 years |
| Immigrants | Central America | 5.4 /100 | #227 | Tragic $51,022 |
| Immigrants | Norway | 5.0 /100 | #228 | Tragic $50,984 |
| Yuman | 4.4 /100 | #229 | Tragic $50,933 |
| Jamaicans | 4.4 /100 | #230 | Tragic $50,929 |
| Ugandans | 4.3 /100 | #231 | Tragic $50,923 |
| Slovenes | 4.0 /100 | #232 | Tragic $50,886 |
| Pennsylvania Germans | 3.7 /100 | #233 | Tragic $50,852 |
| Kenyans | 3.3 /100 | #234 | Tragic $50,815 |
| Spanish | 3.3 /100 | #235 | Tragic $50,813 |
| English | 3.3 /100 | #236 | Tragic $50,805 |
| Germans | 3.3 /100 | #237 | Tragic $50,804 |
| Iraqis | 3.2 /100 | #238 | Tragic $50,802 |
| Immigrants | Caribbean | 2.9 /100 | #239 | Tragic $50,757 |
| Immigrants | Lebanon | 2.7 /100 | #240 | Tragic $50,729 |
| Immigrants | Micronesia | 2.5 /100 | #241 | Tragic $50,691 |