Immigrants from Laos vs Immigrants from Scotland Female Disability
COMPARE
Immigrants from Laos
Immigrants from Scotland
Female Disability
Female Disability Comparison
Immigrants from Laos
Immigrants from Scotland
12.8%
FEMALE DISABILITY
0.4/ 100
METRIC RATING
268th/ 347
METRIC RANK
12.0%
FEMALE DISABILITY
79.3/ 100
METRIC RATING
152nd/ 347
METRIC RANK
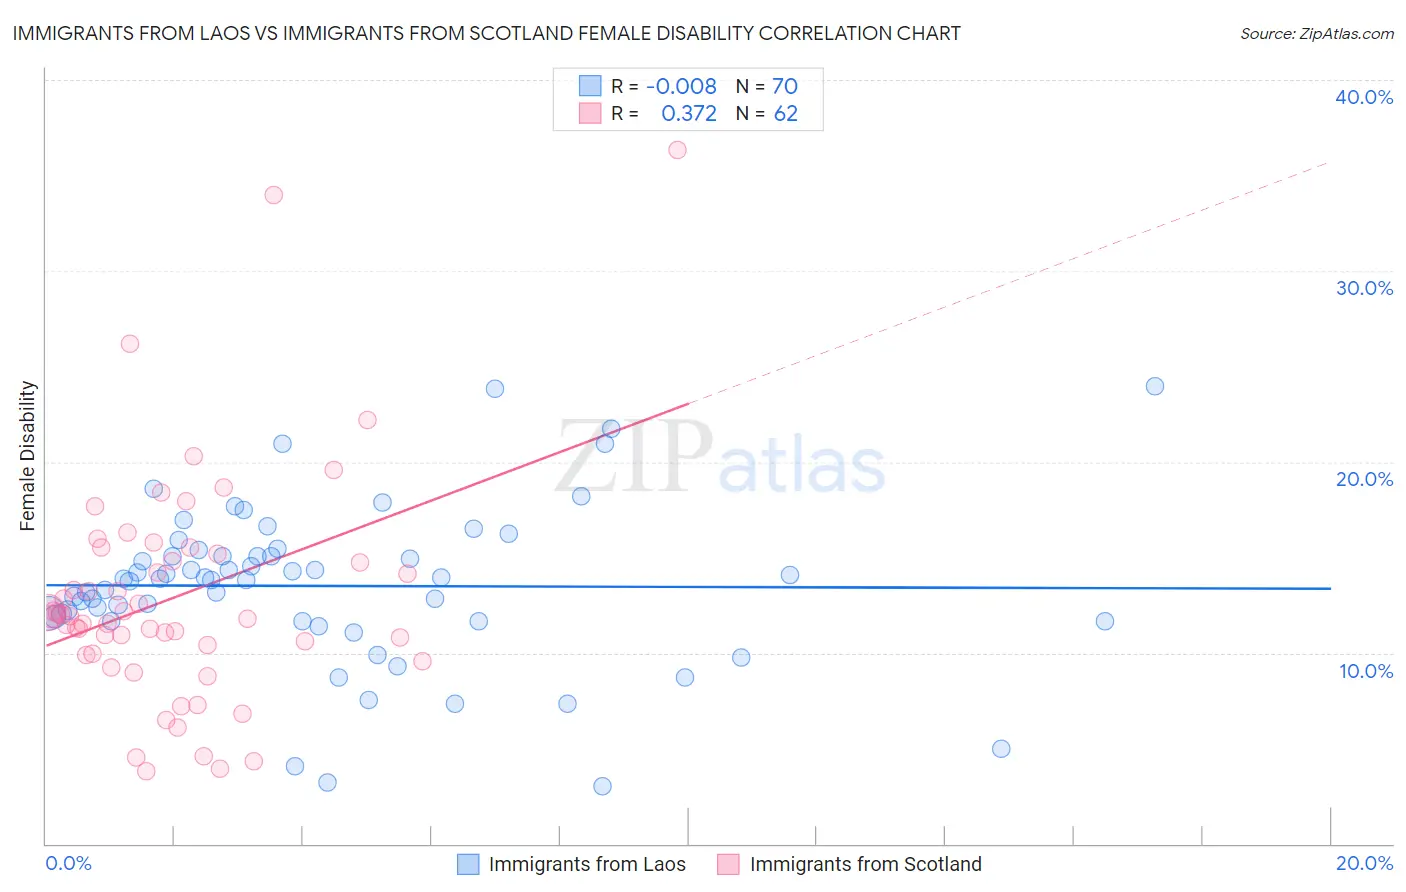
Immigrants from Laos vs Immigrants from Scotland Female Disability Correlation Chart
The statistical analysis conducted on geographies consisting of 201,465,776 people shows no correlation between the proportion of Immigrants from Laos and percentage of females with a disability in the United States with a correlation coefficient (R) of -0.008 and weighted average of 12.8%. Similarly, the statistical analysis conducted on geographies consisting of 196,394,283 people shows a mild positive correlation between the proportion of Immigrants from Scotland and percentage of females with a disability in the United States with a correlation coefficient (R) of 0.372 and weighted average of 12.0%, a difference of 6.5%.
Female Disability Correlation Summary
| Measurement | Immigrants from Laos | Immigrants from Scotland |
| Minimum | 3.0% | 3.8% |
| Maximum | 24.0% | 36.4% |
| Range | 20.9% | 32.6% |
| Mean | 13.5% | 12.9% |
| Median | 13.9% | 11.9% |
| Interquartile 25% (IQ1) | 11.7% | 9.9% |
| Interquartile 75% (IQ3) | 15.1% | 15.2% |
| Interquartile Range (IQR) | 3.4% | 5.3% |
| Standard Deviation (Sample) | 4.1% | 6.0% |
| Standard Deviation (Population) | 4.1% | 6.0% |
Similar Demographics by Female Disability
Demographics Similar to Immigrants from Laos by Female Disability
In terms of female disability, the demographic groups most similar to Immigrants from Laos are Senegalese (12.8%, a difference of 0.030%), Finnish (12.8%, a difference of 0.040%), Indonesian (12.8%, a difference of 0.060%), West Indian (12.8%, a difference of 0.16%), and Immigrants from Liberia (12.9%, a difference of 0.24%).
| Demographics | Rating | Rank | Female Disability |
| Bermudans | 1.0 /100 | #261 | Tragic 12.7% |
| Czechoslovakians | 0.9 /100 | #262 | Tragic 12.7% |
| Spaniards | 0.7 /100 | #263 | Tragic 12.8% |
| Alaska Natives | 0.6 /100 | #264 | Tragic 12.8% |
| West Indians | 0.5 /100 | #265 | Tragic 12.8% |
| Finns | 0.4 /100 | #266 | Tragic 12.8% |
| Senegalese | 0.4 /100 | #267 | Tragic 12.8% |
| Immigrants | Laos | 0.4 /100 | #268 | Tragic 12.8% |
| Indonesians | 0.4 /100 | #269 | Tragic 12.8% |
| Immigrants | Liberia | 0.3 /100 | #270 | Tragic 12.9% |
| Dutch | 0.2 /100 | #271 | Tragic 12.9% |
| Germans | 0.1 /100 | #272 | Tragic 12.9% |
| Sioux | 0.1 /100 | #273 | Tragic 12.9% |
| Portuguese | 0.1 /100 | #274 | Tragic 13.0% |
| Cheyenne | 0.1 /100 | #275 | Tragic 13.0% |
Demographics Similar to Immigrants from Scotland by Female Disability
In terms of female disability, the demographic groups most similar to Immigrants from Scotland are Sudanese (12.0%, a difference of 0.010%), Icelander (12.0%, a difference of 0.090%), Immigrants from Moldova (12.0%, a difference of 0.13%), Syrian (12.1%, a difference of 0.13%), and Ghanaian (12.1%, a difference of 0.15%).
| Demographics | Rating | Rank | Female Disability |
| Estonians | 87.8 /100 | #145 | Excellent 12.0% |
| Pakistanis | 84.6 /100 | #146 | Excellent 12.0% |
| Nigerians | 84.0 /100 | #147 | Excellent 12.0% |
| Immigrants | Kenya | 83.1 /100 | #148 | Excellent 12.0% |
| Greeks | 82.0 /100 | #149 | Excellent 12.0% |
| Immigrants | Moldova | 81.4 /100 | #150 | Excellent 12.0% |
| Icelanders | 80.7 /100 | #151 | Excellent 12.0% |
| Immigrants | Scotland | 79.3 /100 | #152 | Good 12.0% |
| Sudanese | 79.1 /100 | #153 | Good 12.0% |
| Syrians | 76.9 /100 | #154 | Good 12.1% |
| Ghanaians | 76.6 /100 | #155 | Good 12.1% |
| Moroccans | 72.9 /100 | #156 | Good 12.1% |
| Danes | 72.5 /100 | #157 | Good 12.1% |
| Immigrants | Middle Africa | 72.4 /100 | #158 | Good 12.1% |
| Immigrants | Central America | 67.7 /100 | #159 | Good 12.1% |