Osage vs Immigrants from Scotland 1st Grade
COMPARE
Osage
Immigrants from Scotland
1st Grade
1st Grade Comparison
Osage
Immigrants from Scotland
98.3%
1ST GRADE
99.2/ 100
METRIC RATING
80th/ 347
METRIC RANK
98.4%
1ST GRADE
99.8/ 100
METRIC RATING
55th/ 347
METRIC RANK
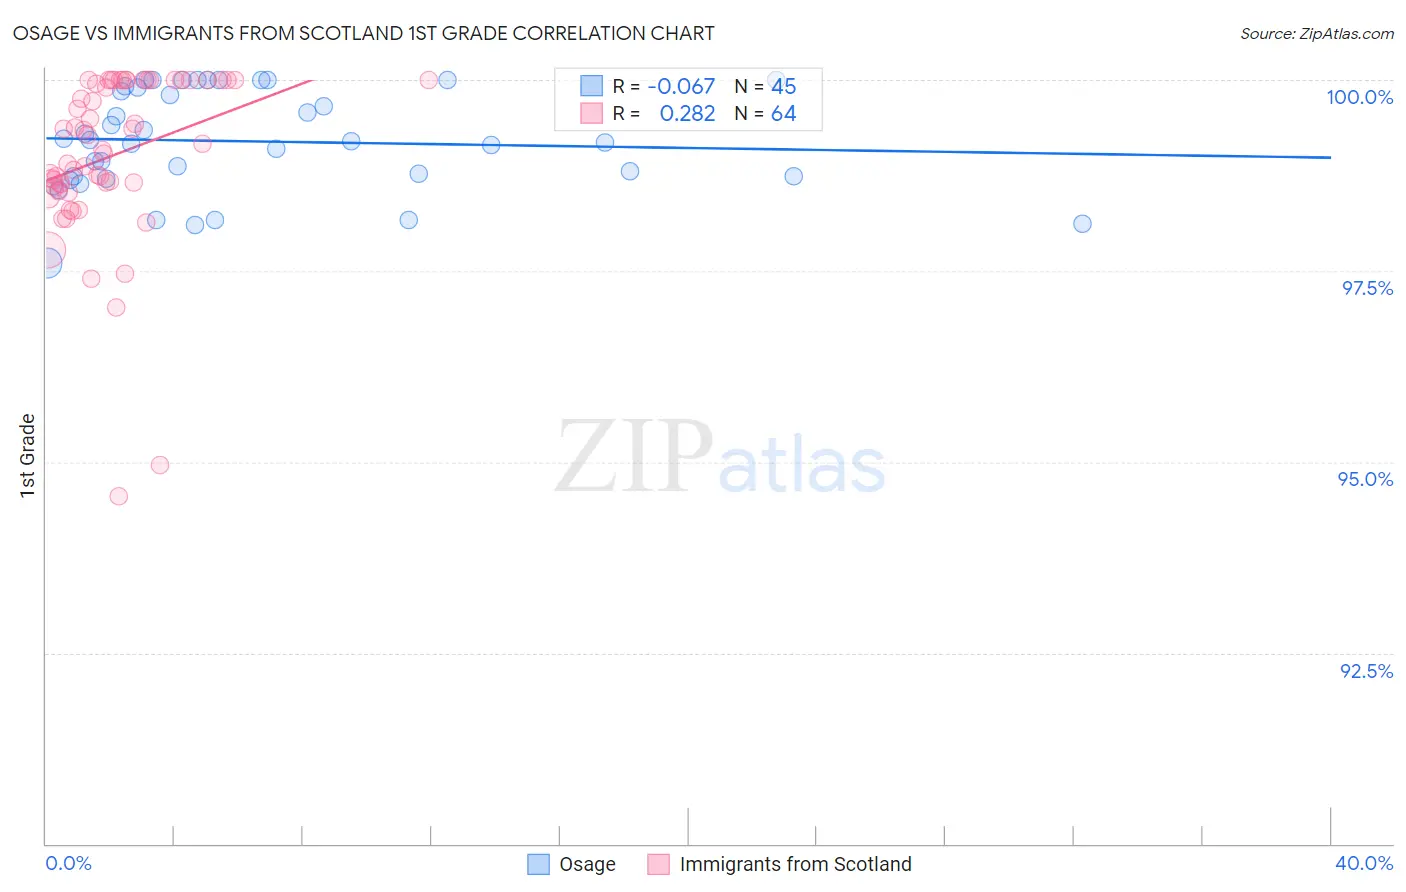
Osage vs Immigrants from Scotland 1st Grade Correlation Chart
The statistical analysis conducted on geographies consisting of 91,808,929 people shows a slight negative correlation between the proportion of Osage and percentage of population with at least 1st grade education in the United States with a correlation coefficient (R) of -0.067 and weighted average of 98.3%. Similarly, the statistical analysis conducted on geographies consisting of 196,398,887 people shows a weak positive correlation between the proportion of Immigrants from Scotland and percentage of population with at least 1st grade education in the United States with a correlation coefficient (R) of 0.282 and weighted average of 98.4%, a difference of 0.11%.
1st Grade Correlation Summary
| Measurement | Osage | Immigrants from Scotland |
| Minimum | 97.6% | 94.6% |
| Maximum | 100.0% | 100.0% |
| Range | 2.4% | 5.4% |
| Mean | 99.2% | 99.0% |
| Median | 99.2% | 99.1% |
| Interquartile 25% (IQ1) | 98.7% | 98.6% |
| Interquartile 75% (IQ3) | 99.9% | 100.0% |
| Interquartile Range (IQR) | 1.2% | 1.4% |
| Standard Deviation (Sample) | 0.66% | 1.1% |
| Standard Deviation (Population) | 0.66% | 1.1% |
Similar Demographics by 1st Grade
Demographics Similar to Osage by 1st Grade
In terms of 1st grade, the demographic groups most similar to Osage are Immigrants from Lithuania (98.3%, a difference of 0.0%), Potawatomi (98.3%, a difference of 0.0%), Icelander (98.3%, a difference of 0.0%), Immigrants from England (98.3%, a difference of 0.010%), and Immigrants from Belgium (98.3%, a difference of 0.010%).
| Demographics | Rating | Rank | 1st Grade |
| Cajuns | 99.5 /100 | #73 | Exceptional 98.3% |
| Immigrants | Netherlands | 99.4 /100 | #74 | Exceptional 98.3% |
| Cherokee | 99.3 /100 | #75 | Exceptional 98.3% |
| Shoshone | 99.3 /100 | #76 | Exceptional 98.3% |
| Immigrants | England | 99.3 /100 | #77 | Exceptional 98.3% |
| Immigrants | Belgium | 99.2 /100 | #78 | Exceptional 98.3% |
| Immigrants | Lithuania | 99.2 /100 | #79 | Exceptional 98.3% |
| Osage | 99.2 /100 | #80 | Exceptional 98.3% |
| Potawatomi | 99.1 /100 | #81 | Exceptional 98.3% |
| Icelanders | 99.1 /100 | #82 | Exceptional 98.3% |
| Immigrants | Sweden | 99.1 /100 | #83 | Exceptional 98.3% |
| Delaware | 99.1 /100 | #84 | Exceptional 98.3% |
| Hopi | 99.0 /100 | #85 | Exceptional 98.3% |
| Immigrants | Denmark | 99.0 /100 | #86 | Exceptional 98.3% |
| Immigrants | Australia | 99.0 /100 | #87 | Exceptional 98.3% |
Demographics Similar to Immigrants from Scotland by 1st Grade
In terms of 1st grade, the demographic groups most similar to Immigrants from Scotland are Pueblo (98.4%, a difference of 0.010%), Kiowa (98.4%, a difference of 0.010%), Australian (98.4%, a difference of 0.010%), American (98.4%, a difference of 0.010%), and Austrian (98.4%, a difference of 0.010%).
| Demographics | Rating | Rank | 1st Grade |
| Czechoslovakians | 99.8 /100 | #48 | Exceptional 98.4% |
| Celtics | 99.8 /100 | #49 | Exceptional 98.4% |
| Whites/Caucasians | 99.8 /100 | #50 | Exceptional 98.4% |
| Estonians | 99.8 /100 | #51 | Exceptional 98.4% |
| Pueblo | 99.8 /100 | #52 | Exceptional 98.4% |
| Kiowa | 99.8 /100 | #53 | Exceptional 98.4% |
| Australians | 99.8 /100 | #54 | Exceptional 98.4% |
| Immigrants | Scotland | 99.8 /100 | #55 | Exceptional 98.4% |
| Americans | 99.8 /100 | #56 | Exceptional 98.4% |
| Austrians | 99.8 /100 | #57 | Exceptional 98.4% |
| New Zealanders | 99.7 /100 | #58 | Exceptional 98.4% |
| Creek | 99.7 /100 | #59 | Exceptional 98.4% |
| Immigrants | Canada | 99.7 /100 | #60 | Exceptional 98.4% |
| Bulgarians | 99.7 /100 | #61 | Exceptional 98.4% |
| Slavs | 99.7 /100 | #62 | Exceptional 98.4% |