Jordanian vs Immigrants from Laos Female Disability
COMPARE
Jordanian
Immigrants from Laos
Female Disability
Female Disability Comparison
Jordanians
Immigrants from Laos
11.3%
FEMALE DISABILITY
100.0/ 100
METRIC RATING
47th/ 347
METRIC RANK
12.8%
FEMALE DISABILITY
0.4/ 100
METRIC RATING
268th/ 347
METRIC RANK
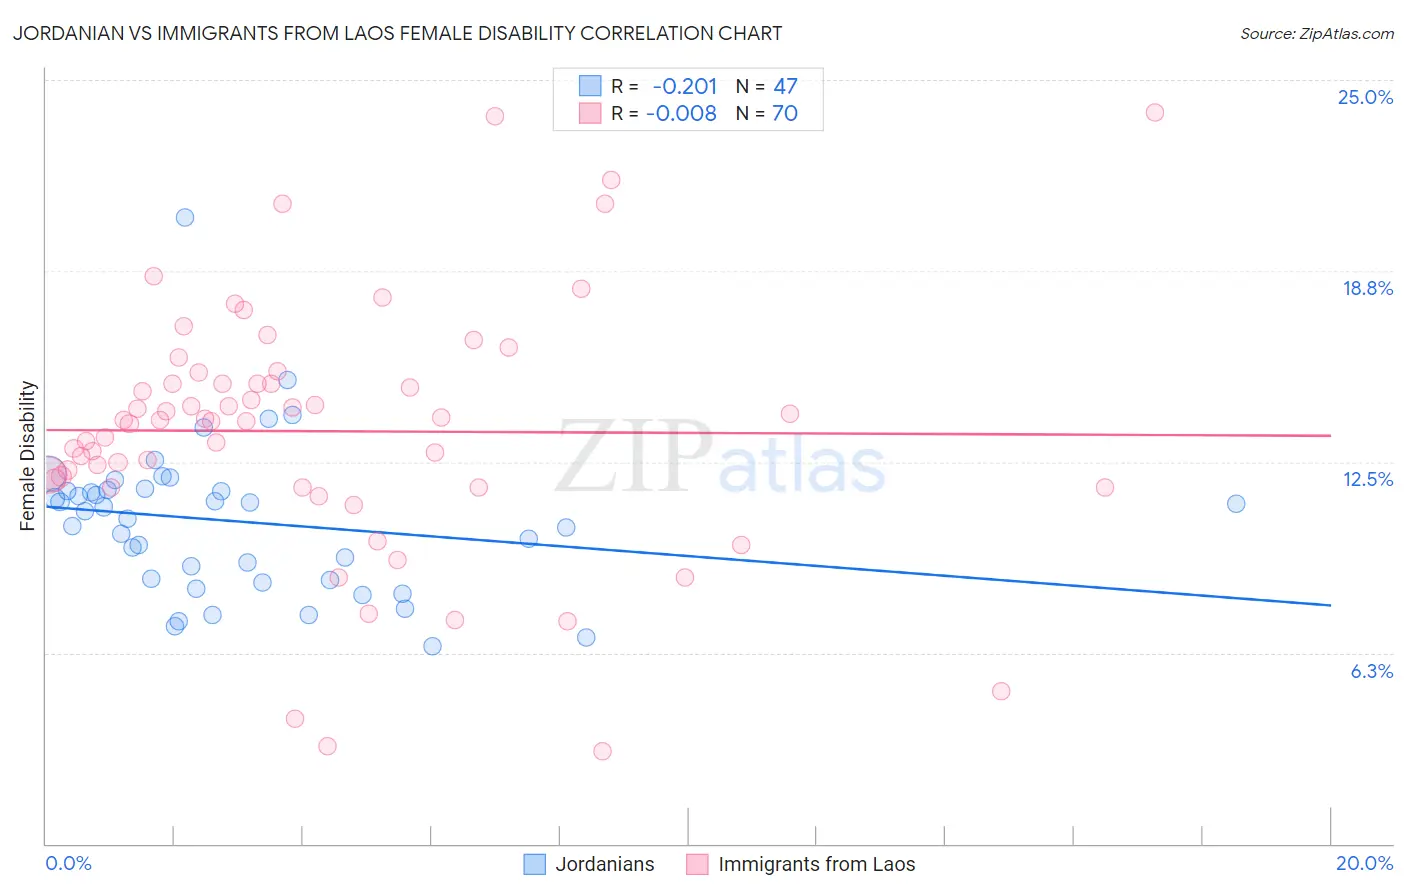
Jordanian vs Immigrants from Laos Female Disability Correlation Chart
The statistical analysis conducted on geographies consisting of 166,415,888 people shows a weak negative correlation between the proportion of Jordanians and percentage of females with a disability in the United States with a correlation coefficient (R) of -0.201 and weighted average of 11.3%. Similarly, the statistical analysis conducted on geographies consisting of 201,465,776 people shows no correlation between the proportion of Immigrants from Laos and percentage of females with a disability in the United States with a correlation coefficient (R) of -0.008 and weighted average of 12.8%, a difference of 13.8%.
Female Disability Correlation Summary
| Measurement | Jordanian | Immigrants from Laos |
| Minimum | 6.5% | 3.0% |
| Maximum | 20.5% | 24.0% |
| Range | 14.0% | 20.9% |
| Mean | 10.6% | 13.5% |
| Median | 10.9% | 13.9% |
| Interquartile 25% (IQ1) | 8.6% | 11.7% |
| Interquartile 75% (IQ3) | 11.6% | 15.1% |
| Interquartile Range (IQR) | 3.0% | 3.4% |
| Standard Deviation (Sample) | 2.5% | 4.1% |
| Standard Deviation (Population) | 2.5% | 4.1% |
Similar Demographics by Female Disability
Demographics Similar to Jordanians by Female Disability
In terms of female disability, the demographic groups most similar to Jordanians are Zimbabwean (11.3%, a difference of 0.0%), Tongan (11.3%, a difference of 0.010%), Immigrants from Nepal (11.3%, a difference of 0.020%), Immigrants from Sweden (11.3%, a difference of 0.060%), and Cambodian (11.3%, a difference of 0.10%).
| Demographics | Rating | Rank | Female Disability |
| Mongolians | 100.0 /100 | #40 | Exceptional 11.2% |
| Paraguayans | 100.0 /100 | #41 | Exceptional 11.2% |
| Israelis | 100.0 /100 | #42 | Exceptional 11.2% |
| Afghans | 100.0 /100 | #43 | Exceptional 11.2% |
| Cambodians | 100.0 /100 | #44 | Exceptional 11.3% |
| Immigrants | Sweden | 100.0 /100 | #45 | Exceptional 11.3% |
| Immigrants | Nepal | 100.0 /100 | #46 | Exceptional 11.3% |
| Jordanians | 100.0 /100 | #47 | Exceptional 11.3% |
| Zimbabweans | 100.0 /100 | #48 | Exceptional 11.3% |
| Tongans | 100.0 /100 | #49 | Exceptional 11.3% |
| Inupiat | 100.0 /100 | #50 | Exceptional 11.3% |
| Immigrants | Belgium | 100.0 /100 | #51 | Exceptional 11.3% |
| Immigrants | Peru | 99.9 /100 | #52 | Exceptional 11.3% |
| Immigrants | Saudi Arabia | 99.9 /100 | #53 | Exceptional 11.3% |
| Peruvians | 99.9 /100 | #54 | Exceptional 11.3% |
Demographics Similar to Immigrants from Laos by Female Disability
In terms of female disability, the demographic groups most similar to Immigrants from Laos are Senegalese (12.8%, a difference of 0.030%), Finnish (12.8%, a difference of 0.040%), Indonesian (12.8%, a difference of 0.060%), West Indian (12.8%, a difference of 0.16%), and Immigrants from Liberia (12.9%, a difference of 0.24%).
| Demographics | Rating | Rank | Female Disability |
| Bermudans | 1.0 /100 | #261 | Tragic 12.7% |
| Czechoslovakians | 0.9 /100 | #262 | Tragic 12.7% |
| Spaniards | 0.7 /100 | #263 | Tragic 12.8% |
| Alaska Natives | 0.6 /100 | #264 | Tragic 12.8% |
| West Indians | 0.5 /100 | #265 | Tragic 12.8% |
| Finns | 0.4 /100 | #266 | Tragic 12.8% |
| Senegalese | 0.4 /100 | #267 | Tragic 12.8% |
| Immigrants | Laos | 0.4 /100 | #268 | Tragic 12.8% |
| Indonesians | 0.4 /100 | #269 | Tragic 12.8% |
| Immigrants | Liberia | 0.3 /100 | #270 | Tragic 12.9% |
| Dutch | 0.2 /100 | #271 | Tragic 12.9% |
| Germans | 0.1 /100 | #272 | Tragic 12.9% |
| Sioux | 0.1 /100 | #273 | Tragic 12.9% |
| Portuguese | 0.1 /100 | #274 | Tragic 13.0% |
| Cheyenne | 0.1 /100 | #275 | Tragic 13.0% |