Osage vs Immigrants from Laos Professional Degree
COMPARE
Osage
Immigrants from Laos
Professional Degree
Professional Degree Comparison
Osage
Immigrants from Laos
3.7%
PROFESSIONAL DEGREE
1.2/ 100
METRIC RATING
255th/ 347
METRIC RANK
3.2%
PROFESSIONAL DEGREE
0.1/ 100
METRIC RATING
315th/ 347
METRIC RANK
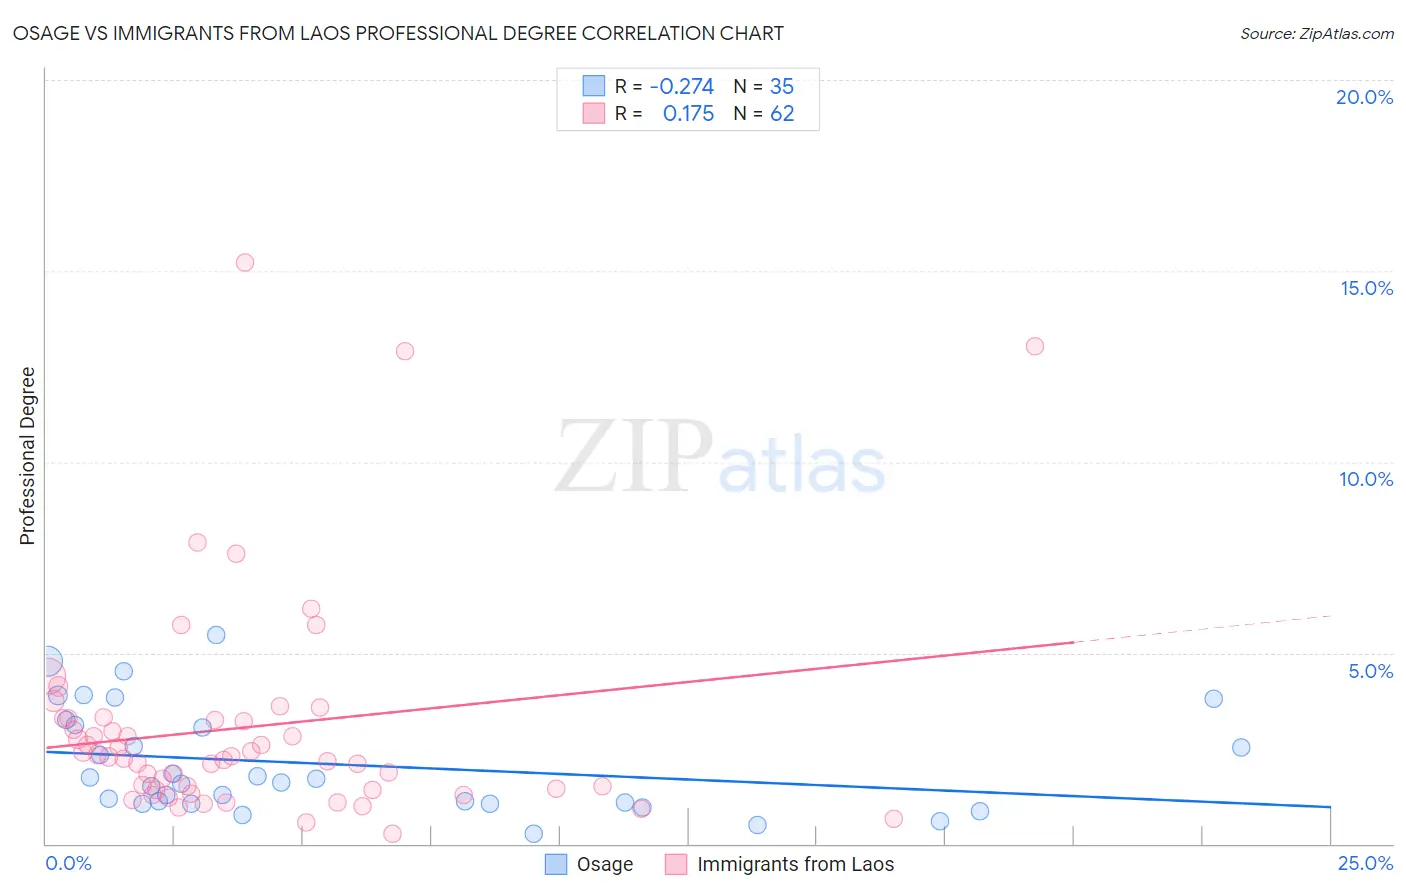
Osage vs Immigrants from Laos Professional Degree Correlation Chart
The statistical analysis conducted on geographies consisting of 91,695,993 people shows a weak negative correlation between the proportion of Osage and percentage of population with at least professional degree education in the United States with a correlation coefficient (R) of -0.274 and weighted average of 3.7%. Similarly, the statistical analysis conducted on geographies consisting of 201,278,168 people shows a poor positive correlation between the proportion of Immigrants from Laos and percentage of population with at least professional degree education in the United States with a correlation coefficient (R) of 0.175 and weighted average of 3.2%, a difference of 14.0%.
Professional Degree Correlation Summary
| Measurement | Osage | Immigrants from Laos |
| Minimum | 0.26% | 0.26% |
| Maximum | 5.5% | 15.2% |
| Range | 5.2% | 15.0% |
| Mean | 2.1% | 3.1% |
| Median | 1.6% | 2.3% |
| Interquartile 25% (IQ1) | 1.1% | 1.4% |
| Interquartile 75% (IQ3) | 3.1% | 3.3% |
| Interquartile Range (IQR) | 2.0% | 1.9% |
| Standard Deviation (Sample) | 1.4% | 2.9% |
| Standard Deviation (Population) | 1.3% | 2.9% |
Similar Demographics by Professional Degree
Demographics Similar to Osage by Professional Degree
In terms of professional degree, the demographic groups most similar to Osage are Iroquois (3.7%, a difference of 0.10%), Tongan (3.7%, a difference of 0.43%), Bahamian (3.7%, a difference of 0.47%), Immigrants from St. Vincent and the Grenadines (3.7%, a difference of 0.54%), and Pueblo (3.7%, a difference of 0.57%).
| Demographics | Rating | Rank | Professional Degree |
| Hmong | 1.6 /100 | #248 | Tragic 3.7% |
| Immigrants | Grenada | 1.5 /100 | #249 | Tragic 3.7% |
| Immigrants | Fiji | 1.5 /100 | #250 | Tragic 3.7% |
| Immigrants | Nicaragua | 1.4 /100 | #251 | Tragic 3.7% |
| Jamaicans | 1.4 /100 | #252 | Tragic 3.7% |
| Pueblo | 1.4 /100 | #253 | Tragic 3.7% |
| Tongans | 1.3 /100 | #254 | Tragic 3.7% |
| Osage | 1.2 /100 | #255 | Tragic 3.7% |
| Iroquois | 1.2 /100 | #256 | Tragic 3.7% |
| Bahamians | 1.1 /100 | #257 | Tragic 3.7% |
| Immigrants | St. Vincent and the Grenadines | 1.1 /100 | #258 | Tragic 3.7% |
| Africans | 1.0 /100 | #259 | Tragic 3.7% |
| Indonesians | 1.0 /100 | #260 | Tragic 3.7% |
| Immigrants | Guyana | 1.0 /100 | #261 | Tragic 3.7% |
| U.S. Virgin Islanders | 1.0 /100 | #262 | Tragic 3.7% |
Demographics Similar to Immigrants from Laos by Professional Degree
In terms of professional degree, the demographic groups most similar to Immigrants from Laos are Puerto Rican (3.2%, a difference of 0.010%), Nepalese (3.2%, a difference of 0.22%), Immigrants from Micronesia (3.2%, a difference of 0.25%), Choctaw (3.2%, a difference of 0.50%), and Mexican American Indian (3.3%, a difference of 0.68%).
| Demographics | Rating | Rank | Professional Degree |
| Shoshone | 0.1 /100 | #308 | Tragic 3.3% |
| Pima | 0.1 /100 | #309 | Tragic 3.3% |
| Immigrants | Latin America | 0.1 /100 | #310 | Tragic 3.3% |
| Cherokee | 0.1 /100 | #311 | Tragic 3.3% |
| Sioux | 0.1 /100 | #312 | Tragic 3.3% |
| Yuman | 0.1 /100 | #313 | Tragic 3.3% |
| Mexican American Indians | 0.1 /100 | #314 | Tragic 3.3% |
| Immigrants | Laos | 0.1 /100 | #315 | Tragic 3.2% |
| Puerto Ricans | 0.1 /100 | #316 | Tragic 3.2% |
| Nepalese | 0.1 /100 | #317 | Tragic 3.2% |
| Immigrants | Micronesia | 0.1 /100 | #318 | Tragic 3.2% |
| Choctaw | 0.1 /100 | #319 | Tragic 3.2% |
| Seminole | 0.1 /100 | #320 | Tragic 3.2% |
| Tsimshian | 0.0 /100 | #321 | Tragic 3.2% |
| Hispanics or Latinos | 0.0 /100 | #322 | Tragic 3.2% |